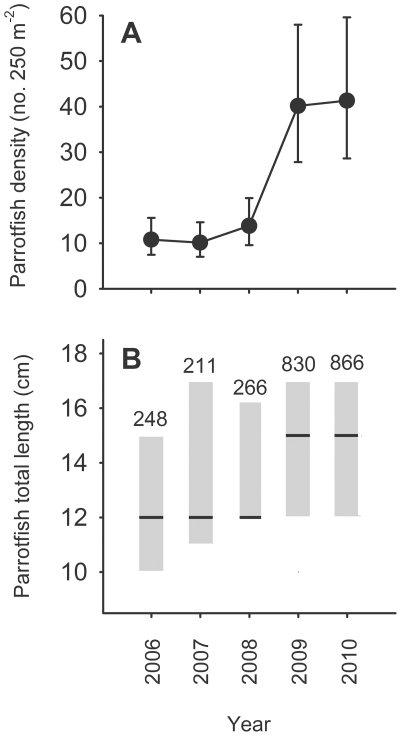
Figure 4. Parrotfish dynamics.
(A) Temporal pattern of abundance (mean±95% CI) of parrotfish on the forereef. (B) Box plot showing changes in the median size of parrotfish on the forereef. Lines are the median size and boxes encompass the 25th and 75th percentiles. Sample sizes are given above each box.

