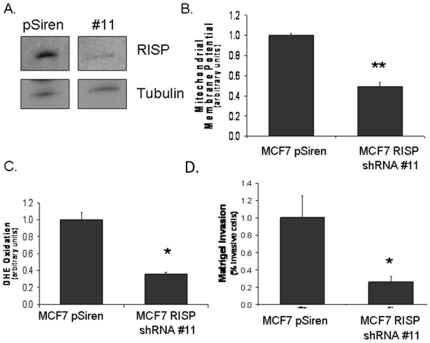
Figure 5. UQCRFS1/RISP knock-down results in mitochondrial dysfunction.
A. RISP levels in MCF7 cells 3 day after transduction with anti-RISP shRNA (clone #11). pSiren was used as the vector control. B. Mitochondrial membrane potential of RISP knockdown cells. Membrane potential was measured by TMRE fluorescence. C. ROS levels in RISP knockdown cells. ROS was measured by oxidation of DHE. E. Invasion in RISP knockdown cells. Invasion was measured by a Matrigel invasion assay. Data represent ratio to MCF7 + 1 SEM, * p<0.05, ** p<0.005.

