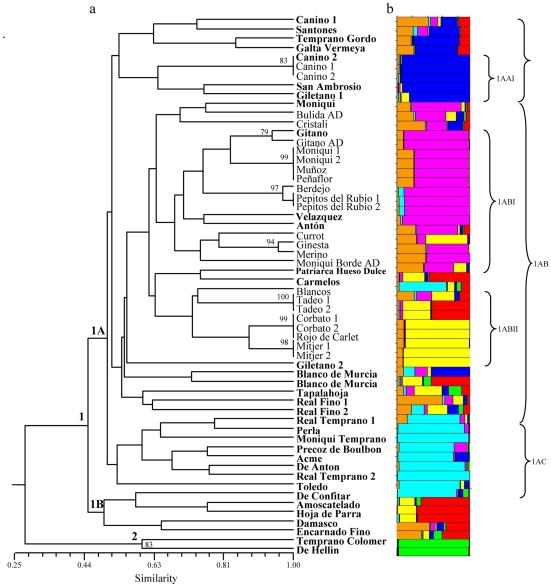
Figure 2. Clustering of 58 apricot accessions from both, old stone and ex situ collections.
(A) Dendrogram based on UPGMA analysis using the similarity matrix generated by the Nei and Li coefficient after amplification with 11 polymorphic SSR loci. The accesions from the stone collection are represented in bold; the rest are the accessions conserved ex situ. (B) Representative estimate of population structure. The plot represent the highest-likelihood run among ten Structure runs with k = 7 putative populations, represented by different colours.

