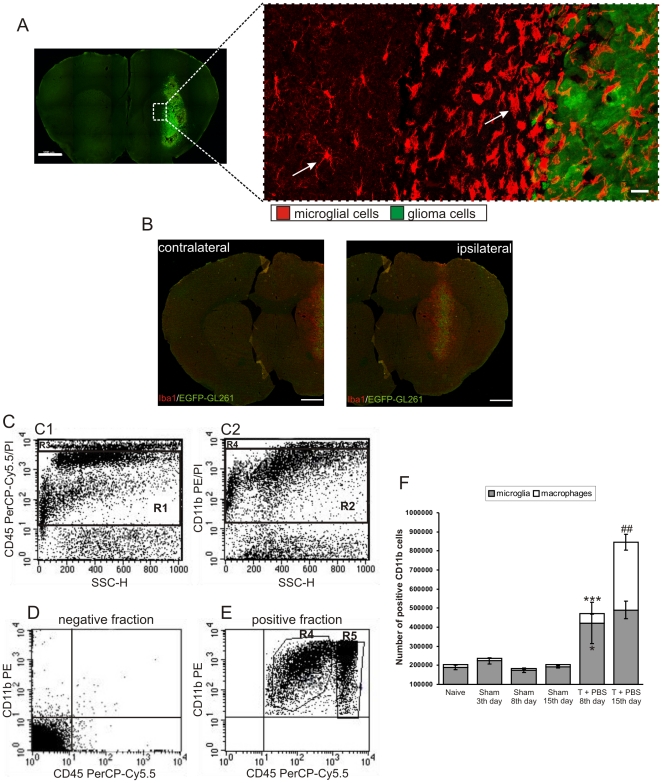
Figure 1. Accumulation and activation of microglia/macrophages in experimental glioma.
A. Representative confocal images of brain sections 15 days after implantation of pEGFP-N1 GL261 cells into the striatum of C57BL/6 mice. Note the infiltration and morphological transformation of glioma-infiltrating Iba1+ cells. Scale bar: left image – 1000 µm, right image – 20 µm. B. Contralateral and ipsilateral hemisphere from tumor-bearing brain 15 days after injection of pEGFP-N1 GL261 cells. Images showed merged Iba1 and EGFP fluorescence. Scale bar = 750 µm. C. Microglia/macrophages were separated using a magnetic-bead-conjugated anti-CD11b antibody and stained with CD45 PerCP-Cy5.5 and CD11b PE prior to FACS acquisition. Propidium iodide staining was performed to eliminate necrotic/apoptotic cells (Gate R3, R4) and viable cells were gated (Gate R1; B1, Gate R2; B2). D. Efficiency of CD11b-positive cells separation in the negative fraction (CD11b-negative cells) from each sample was controlled. E. Representative dot plots for microglia (Gate R4, CD11b+/CD45low) and macrophages (Gate R5, CD11b+/CD45high) from tumor-bearing hemispheres. F. Kinetics of microglia/macrophage influx into tumor tissue. CD11b+ cells separated from the brains of naïve, sham operated and tumor-bearing mice at day 3, 8 or 15 after implantation (n = 4/group) were sorted according to CD45 expression. Each bar represents the mean ± SEM; *** p<0.001, * p<0.05 tumor-bearing mice at 8th day versus naïve mice; ## p<0.01 tumor-bearing mice at day 15 versus day 8.

