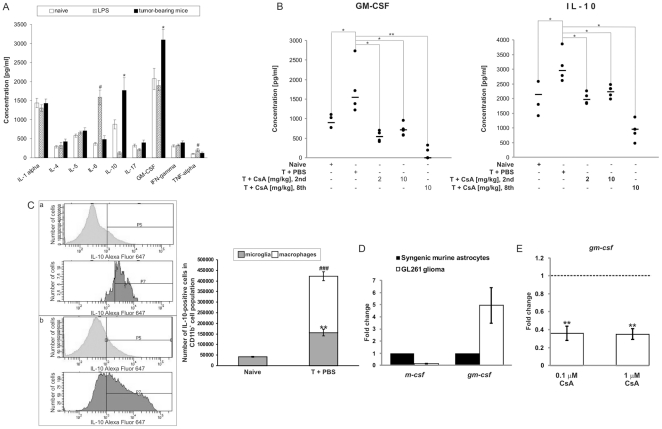
Figure 4. Cytokine profile in glioma-bearing brains.
A. The levels of ten pro/anti-inflammatory cytokines were determined by flow cytometry in protein extracts isolated from hemispheres of naïve, LPS-injected and tumor-bearing mice. The results show the means ± SEM (n = 5 per group); # p<0.05 significant change between LPS-treated v. naïve mice; * p<0.05 significant difference between tumor-bearing v. naïve mice. B. Elevated levels of IL-10 and GM-CSF detected in tumors are reduced by CsA treatment. Each dot represents an individual animal; a horizontal line represents a mean of each group; * p<0.05; ** p<0.01. C. Expression of IL-10 in glioma-infiltrating microglia and macrophages. Left panel: expression of IL-10 on sorted CD11b+ cells (50,000 cells) determined by flow cytometry with the anti-IL-10 antibody conjugated to Alexa Fluor647. Representative histograms of IL-10 detection in microglia (light grey) and macrophages (dark grey) cells from naïve (a) and tumor-bearing (b) brains. Right panel: quantification of microglia/macrophages expressing IL-10 in naïve and tumor-bearing brains (means ± SEM, 3 animals per group); significant increase of IL-10-positive microglia (** p<0.01) and macrophages (### p<0.001) in tumor-bearing brains. D. Quantification of gm-csf and m-csf expression in GL261 glioma cells and non-transformed astrocytes (means ± SD from 3 experiments). E. Quantitative evaluation of gm-csf mRNA expression in GL261 glioma cells exposed to 0.1 and 1 µM CsA for 24 hours (means ± SD from two experiments with three or four replicates per condition) compared to untreated control cells. Statistical analysis was done by Student t test, ** p<0.01.

