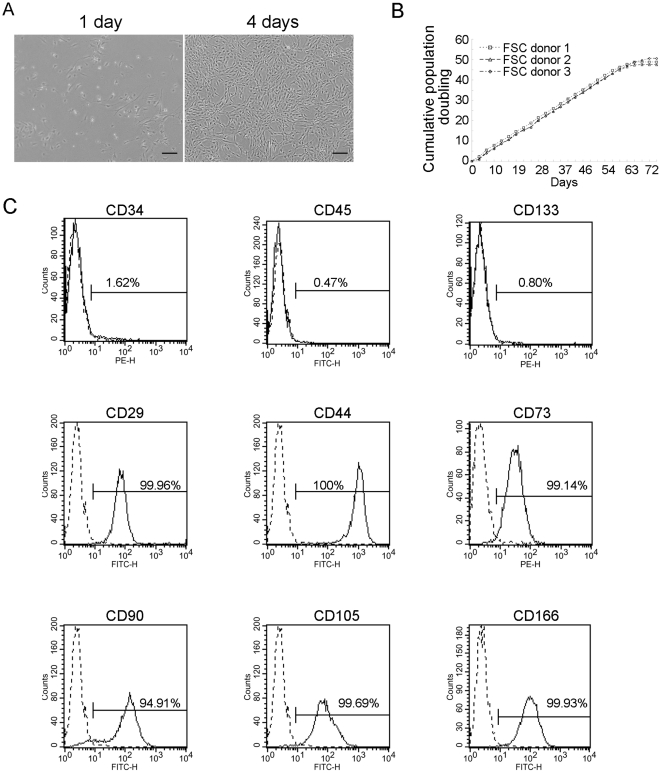
Figure 1. Characterization of FSCs.
(A) Morphology of FSCs 1 and 4 days after seeding. Bars = 200 µm. (B) Proliferation curve of FSCs from different donors. Cumulative population doubling curves vs. time of in vitro culture are based on 3- or 4-day split passages of FSCs at a 1∶5 ratio. (C) Flow cytometric analysis of the surface protein profile of FSCs at passage 4; the dashed line represents the isotype IgG and the solid line indicates the antibody. All experiments were repeated with FSCs from three different donors.

