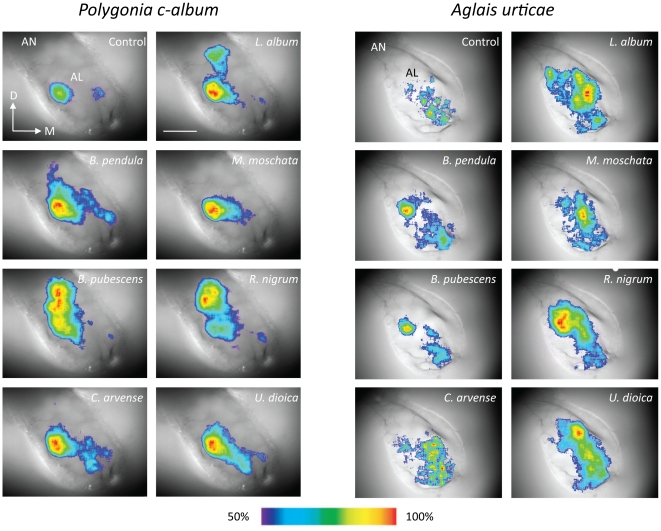
Figure 2. Responses to plant extracts.
False-colour coded images of odour-evoked activity to plant extracts and control (solvent) superimposed on wide-field images of the lobes. Each response is scaled to the upper 50% of its intensity range. D, dorsal; M, medial. AN, antennal nerve; AL, antennal lobe. Scale bar = 100 µm.

