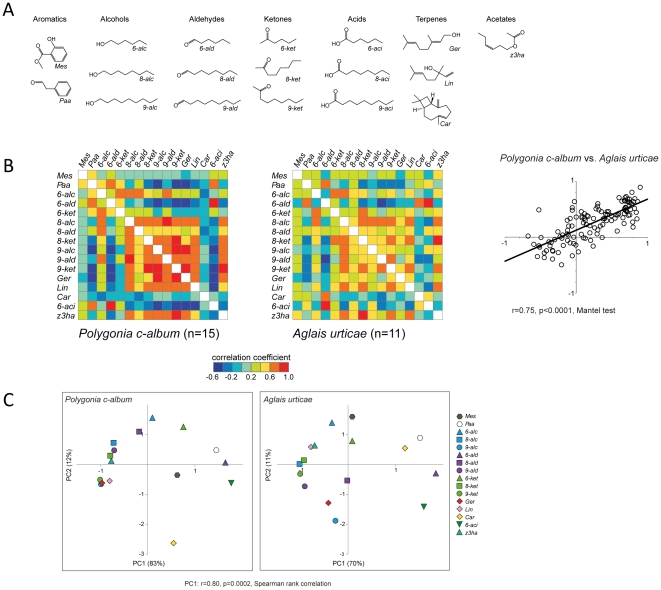
Figure 4. Responses to single compounds.
A Molecular structures of the tested plant related compounds. B Similarity matrices of responses to these compounds. Median correlation values are colour-coded according to scale. Correlation between the species r = 0.75 (p<0.0001, Mantel test). C A principal component analysis showing the first two components for each species. Correlation of the first component (PC1) r = 0.80 (p = 0.0002, Spearman rank correlation).

