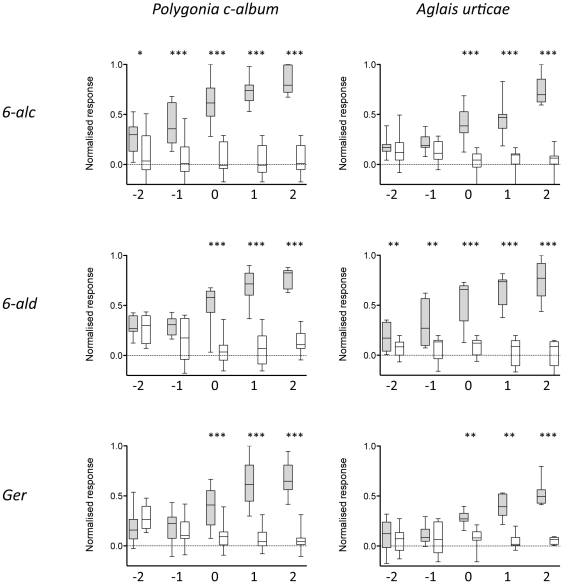
Figure 6. Dose-response correlations.
Responses to hexan-1-ol, hexan-1-al and to geraniol at different doses in P. c-album (n = 14, 8 and 9, respectively) and A. urticae (n = 11, 8 and 7, respectively). The x-axes depict the doses; −2–2 means 4.8×10⁻²–4.8×10² µg (6-alc and 6-ald) or 5.2×10⁻²–5.2×10² µg (Ger). Response values are normalised to the strongest response in each animal. The glomerulus with the strongest activity at each dose is compared with the response to the solvent in that particular glomerulus. A response to an odorant (grey bar) significantly differing from a response to the solvent (white bar) is depicted with asterisks above the bars (two-tailed Wilcoxon matched-pairs signed rank test; * p<0.05, ** p<0.01, *** p<0.001). A box plot shows the median normalised response to an odorant (horizontal line), the 25th and 75th percentile (lower and upper margin of the box) together with the minimum and maximum values (whiskers).

