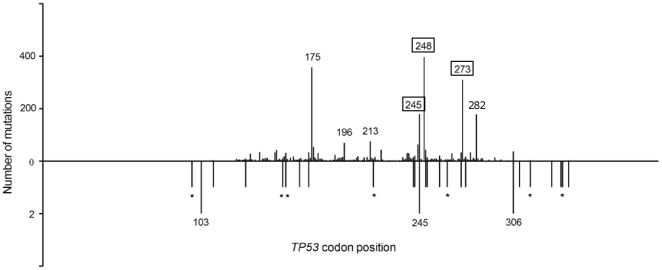
Figure 3. Comparison of the distribution of mutations along the TP53 coding region.
TP53 mutations in CRCs from the UMD database (top) and in our sample (bottom) are depicted. The length of the bars reflects the number of mutations. Seven hot spot positions (representing 10 most common substitutions in UMD) are indicated by codon numbers. Numbers in frames indicates two different frequent substitutions at the same position. In our sample, two different point substitutions were observed in codon 245, and only one of them belonged to the 10 hot spot variants. Asterisks indicate FS mutations in our cohort.

