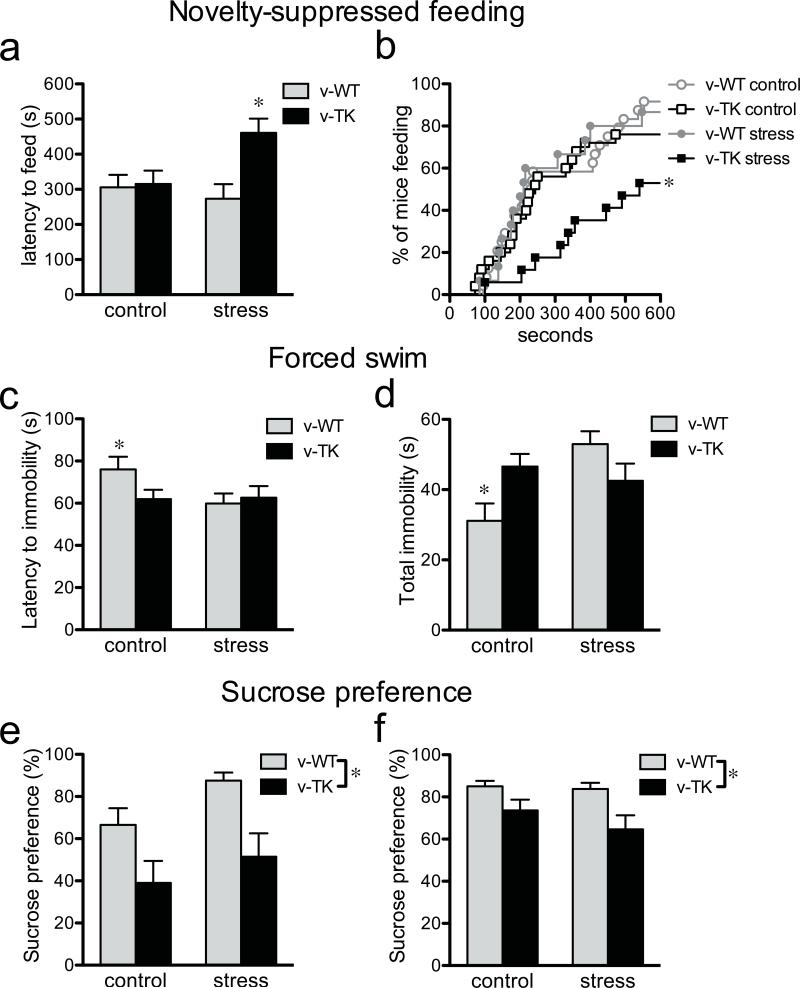
Figure 4.
Mice lacking neurogenesis show increased anxiety/depression-like behaviors. a) In the novelty-suppressed feeding (NSF) test, v-TK mice showed increased latency to feed in a novel environment following restraint stress but not under control conditions (genotype effect F1,75=5.9, P=0.02; stress effect F1,75=1.9, P=0.17; genotype × stress interaction F1,75=4.8, P=0.03; *P<0.05 vs. v-TK control and *P<0.01 vs. v-WT stressed; n=13-25/group). b) Cumulative distribution of feeding latencies for the NSF test (log-rank test; *P<0.05 vs. all other groups). c) Neurogenesis-deficient v-TK mice became immobile faster in the forced swim test. Restraint stress reduced the latency to immobility in v-WT mice but did not affect v-TK mice (genotype effect F1,88=1.1, P=0.3; stress effect F1,88=2.2, P=0.14; genotype × stress interaction F1,88=2.6, P=0.11; *T46=2.1, P<0.05 vs. v-WT stressed; v-TK control vs. v-TK stressed T42=0.1, P=0.9; n=22-26/group). d) Under control conditions, the total time spent immobile was greater in v-TK mice than in v-WT mice. Restraint stress significantly increased total immobility in v-WT mice but had no effect on v-TK mice (genotype effect F1,88=0.3, P=0.6; stress effect F1,88=4.2, P=0.04; genotype × stress interaction F1,88=9.1, P=0.003; *P<0.05 vs. control v-TK, *P<0.001 vs. stressed v-WT, stressed v-WT vs. stressed v-TK P>0.05; n=22-26/group). e) Neurogenesis-deficient v-TK mice showed reduced preference for sucrose in an acute test, compared to v-WT mice, under both control and restraint conditions (genotype effect F1,20=11.2, P<0.01; stress effect F1,20=3.1, P=0.09; genotype × stress interaction F1,20=0.2, P=0.7; n=4-8/group). f) Sucrose preference remained lower in v-TK mice compared to v-WT mice during the subsequent dark cycle (genotype effect F1,25=6.8, P=0.01; stress effect F1,25=0.8, P=0.4; genotype × stress interaction F1,25=0.5, P=0.5; n=4-10/group). Error bars show s.e.m.

