
FIG. 2.
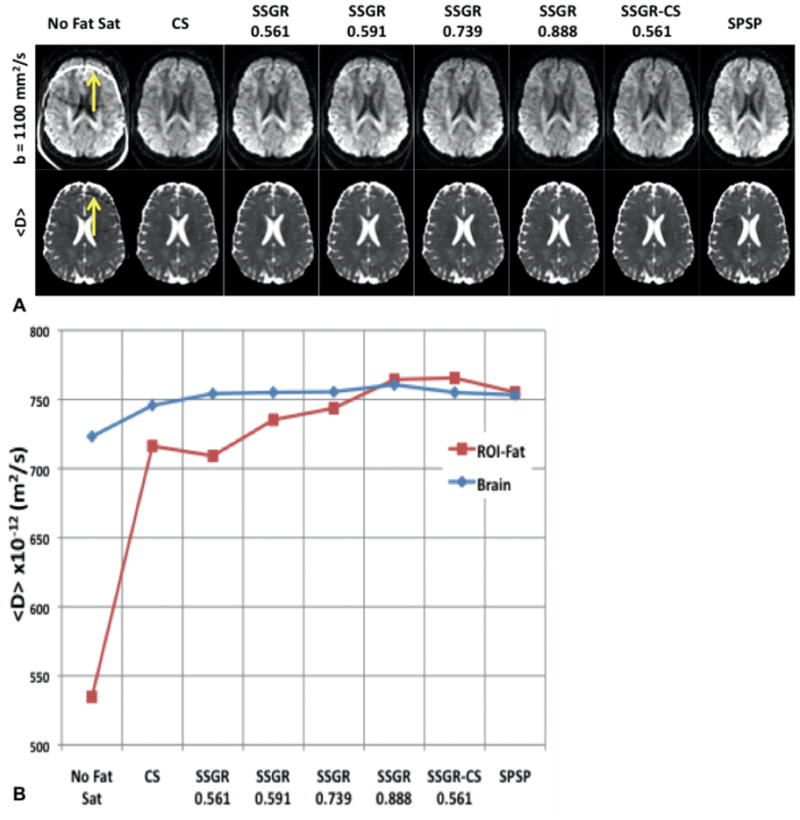
A: Representative slice from the b-value=1100 images (top row) and the <D> maps (bottom row). The SSGR labels are the ratio values, while the yellow arrows indicate residual fat signal. B: Plot of the mean values from the whole brain ROI-fat and the average over all brain tissue.