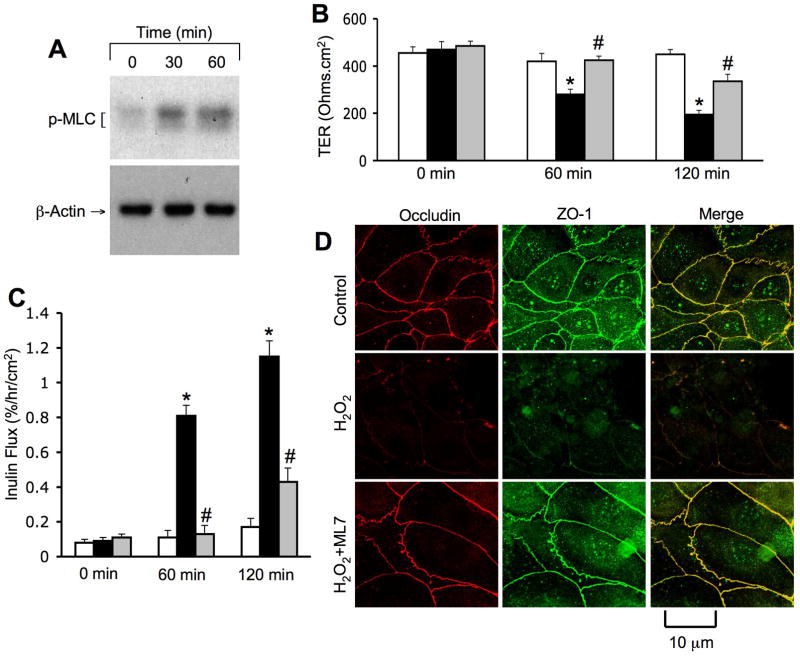
Figure 4. MLCK activity mediates hydrogen peroxide-induced tight junction disruption.
NRC-1 cell monolayers were incubated with (gray) or without ML-7 (white and black bars) followed by incubation with (black and gray bars) or without (white bars) hydrogen peroxidefor 120 min. Protein extracts were immunoblotted for p-MLC and β-actin (A). TER (B) and inulin flux (C) were measured. Values are mean ± sem (n = 6). Asterisks indicate the values that are significantly (p<0.05) different from corresponding control values. Symbol, #, indicates the value that is significantly (p<0.05) different from cells treated with hydrogen peroxide in the absence of ML-7. Cell monolayers were fixed and stained for occludin and ZO-1 (D). Fluorescence images collected using a confocal microscope.

