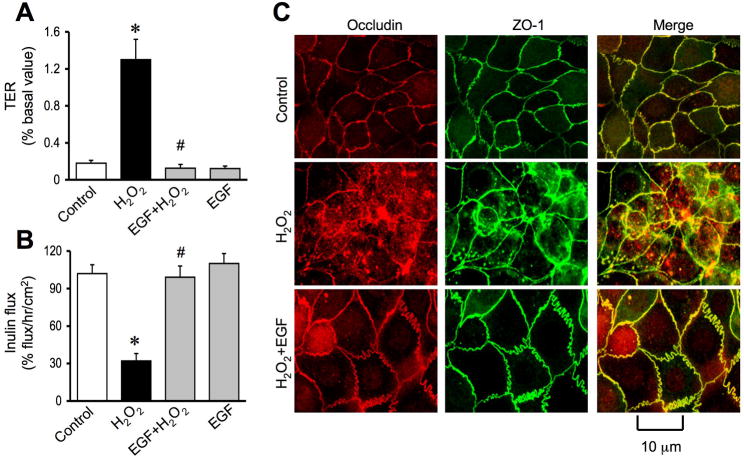
Figure 8. EGF attenuates hydrogen peroxide-induced tight junction disruption.
A & B: NRC-1 cell monolayers were incubated with or without EGF (30 nM) for 10 min followed by administration of hydrogen peroxide (500 μM) for 30 min. TER (A) and inulin flux (B) were measured. Values are mean ± sem (n = 6). Asterisks indicate the values that are significantly (p<0.05) different from corresponding control values. Symbol, #, indicates the value that is significantly (p<0.05) different from values for cells treated with hydrogen peroxide in the absence of EGF. C: Cell monolayers were fixed and stained for occludin and ZO-1. Fluorescence images were collected using a confocal microscope.

