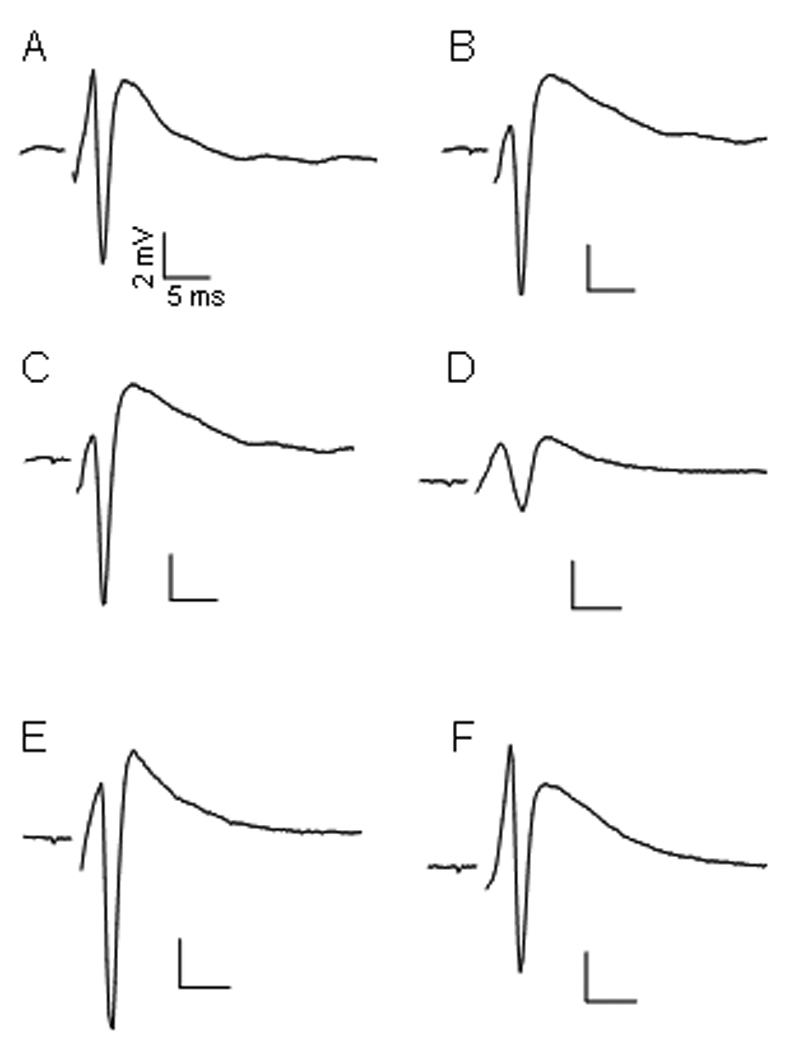
Fig. 2.

Representative PSs of 3 experimental conditions. A, C and E were the initial PS recorded 1 hour after dissection from representative slices from lanes 1 to 3, respectively (see Fig 1). The areas of these PSs were used as 100% to calculate the remaining percent PSs after treatment. B is a PS recorded from lane 1 after 2 additional hours of superfusion with ACSF. D was recorded from lane 2 after 10 min of 200 µM POX followed by 2 hours of ASCF washing. F was recorded from lane 3 after 10 min of 200 µM POX, washed for 30 min with ASCF and finally exposed for 1 hour to 10 µM 4R plus 1 µM atropine.
