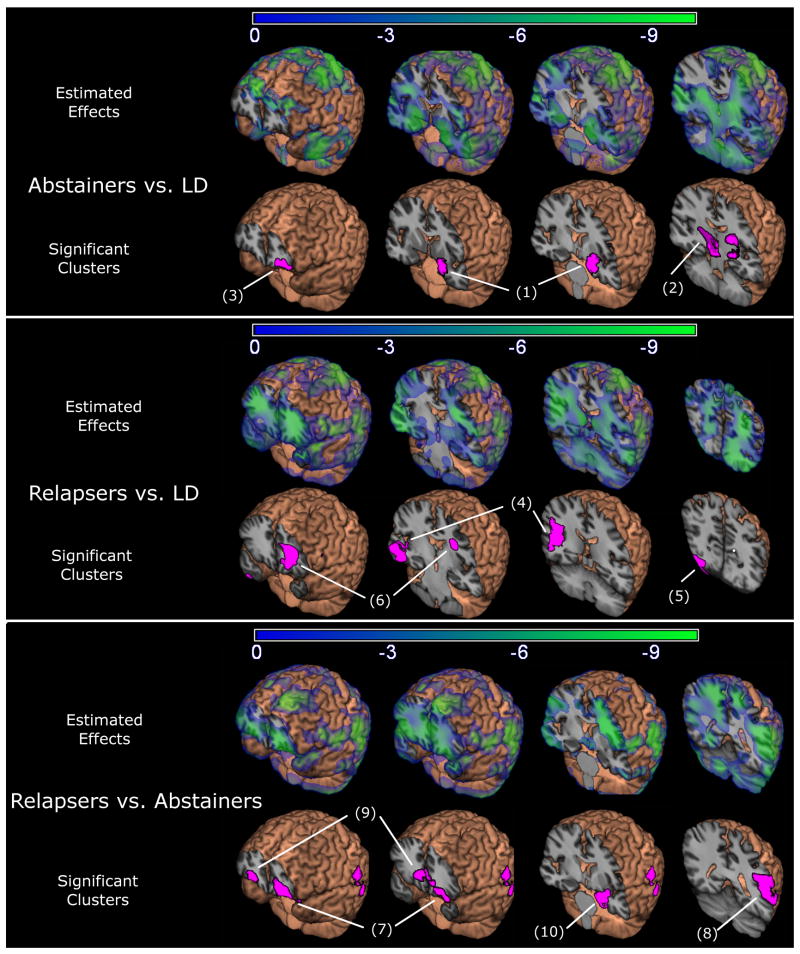
Figure 1.
Estimated effects (beta coefficients) from the regression models and regions of significant relative volume differences are overlaid on the average spatially normalized brain. Voxels shaded blue/green show smaller volume in Abstainers relative to light drinkers (LD, Panel A), Relapsers relative to LD (Panel B), and Relapsers relative to Abstainers (Panel C). Voxels shaded pink show regions (clusters) where volume differences were significant (p<0.05, corrected).

