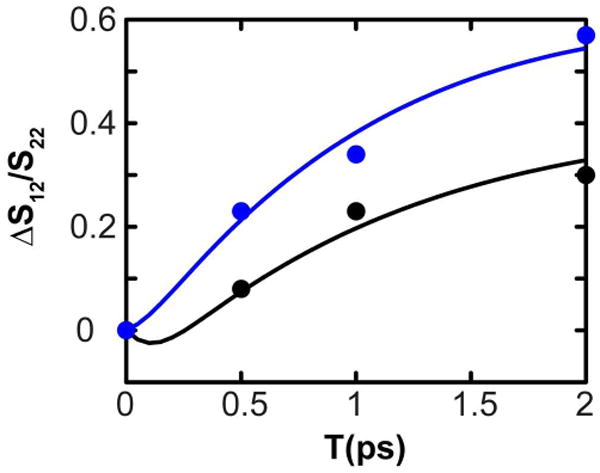
Figure 7.

Cross peak : Diagonal peak evolution with T for XXXX (black) and XXYY (blue) polarization schemes for the guanidyl modes of M2TM. The filled circles are the experimentally obtained values, and the solid lines are the respective fits to the data. The value S12/S22 value at T=0 was subtracted from each data point to give ΔS12/S22.
