
Figure 2.
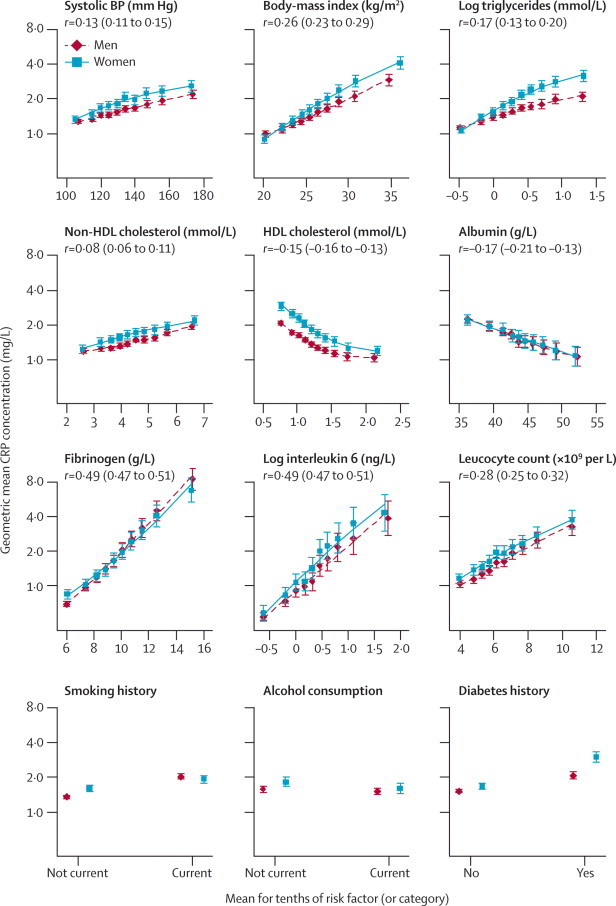
Cross-sectional associations between geometric mean C-reactive protein (CRP) concentration and some conventional risk factors and other characteristics
Mean CRP concentration was adjusted to age 50 years. Error bars represent the 95% CIs. BP=blood pressure. r=Pearson's correlation coefficient (95% CI) for association between the risk marker and loge CRP concentration in men and women combined.