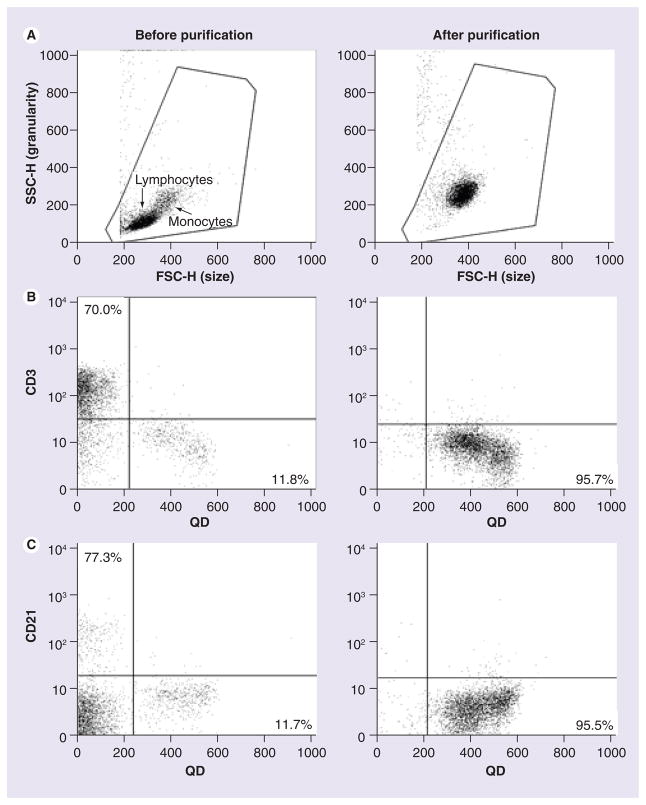
Figure 1. Peripheral blood mononuclear cell and monocyte characterization and QD655-COOH uptake (flow cytometry).
Peripheral blood mononuclear cells (PBMCs) were isolated by Ficoll-Paque gradient centrifugation and monocytes were purified using the MACS separation system with CD14 antibody conjugated beads. Left column, dot plot for PBMCs (before purification); right column, dot plot for monocytes (after purification). (A) The forward-side scatter dot plots depicting lymphocytes and monocytes. (B & C) QD655-COOH at 0.05 nM were incubated with PBMCs or monocytes for 30 min. Cells were labeled with CD3 (T cell marker [B]) and CD21 (B-cell marker [C]). The plots shown are representative of three independent experiments with similar results.
FSC-H: Forward scatter height; QD: Quantum dot; SSC-H: Side scatter height.

