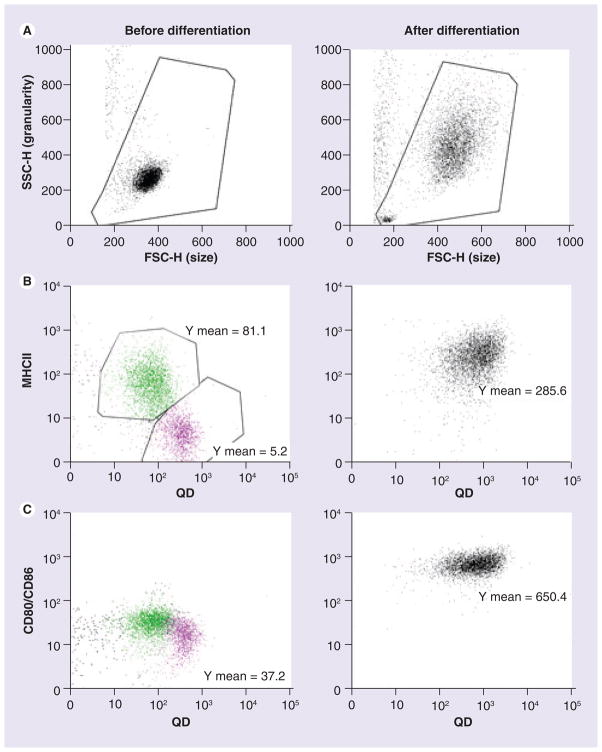
Figure 2. Surface marker expression of monocytes and dendritic cells.
Monocytes were differentiated into dendritic cells (DCs) with GM-CSF and IL-4. Left column, dot plot for monocytes (before differentiation); right column, dot plot for monocyte-derived DCs (after differentiation). (A) The forward-side scatter dot plots depict monocytes or DCs. (B & C) QD655-COOH at 0.05 nM were incubated with monocytes or DC culture for 30 min. Monocytes and DCs were stained with MHCII (B) and CD80/CD86 (C). Green and pink dots indicate the two different cell subsets, respectively. Plots shown are representative of three independent experiments with similar results.
FSC-H: Forward scatter height; QD: Quantum dot; SSC-H: Side scatter height.

