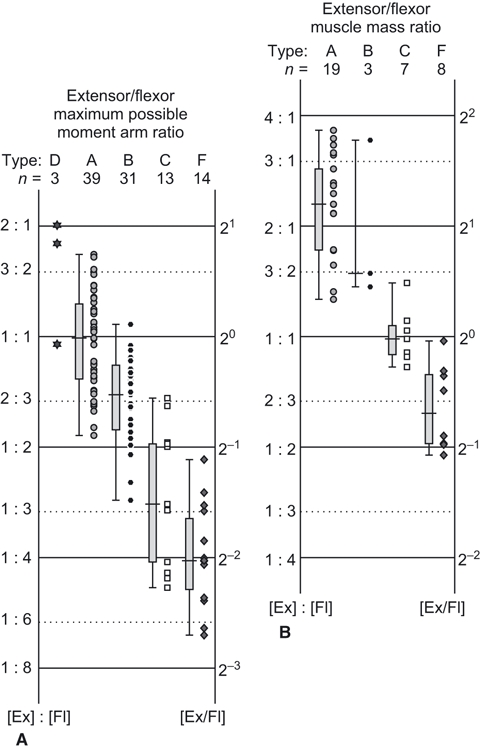
Fig. 10.

Elbow joint extensor/flexor ratios for (A) maximum possible moment arm and (B) total muscle masses. Extensor (Ex) and flexor (Fl) ratios are plotted along the vertical axis, and quartiles for each type of locomotor ability are shown in box plots.
