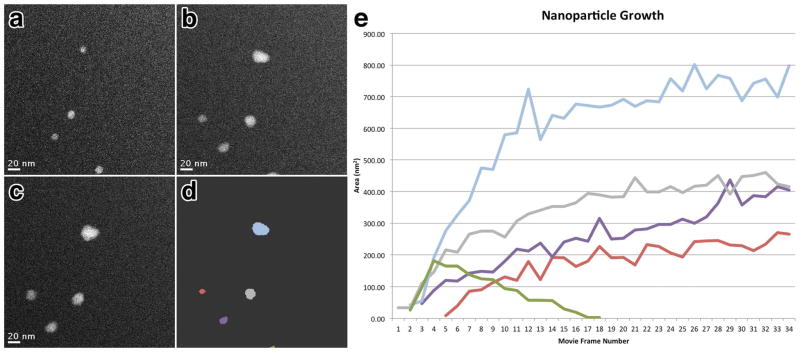
Figure 2. Tracking nanoparticle growth over time.
Correlated image series of the same area at time = 3.5 seconds (a), 15.1 seconds (b) and 26.8 seconds (c) showing the growth of individual PbS nanoparticles. (d) depicts the same image as (b) with individual nanoparticles identified with varying color. (e) plot of nanoparticle area versus time spanning 40 seconds with lines representing individual nanoparticles labeled according to color as in (d). Panels (a–c) correspond to frames 3, 13 and 23 respectively. Scale bars represent 20 nm.

