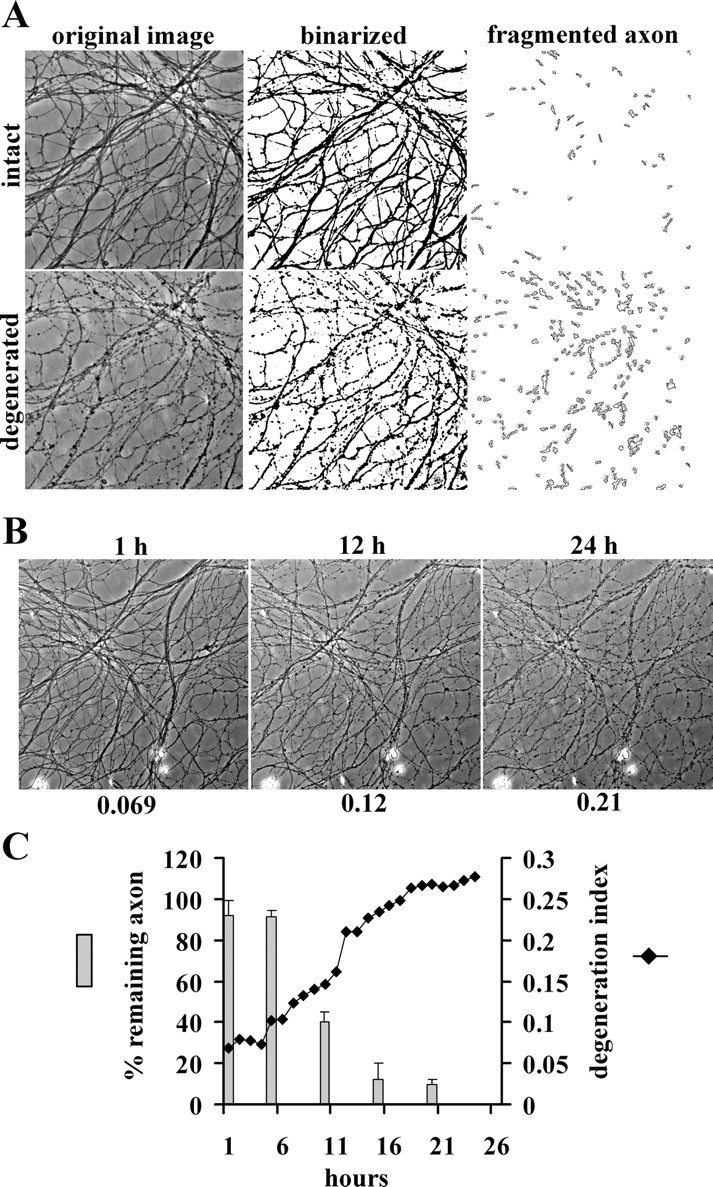
Figure 1.

Quantitative axonal degeneration assay. A, Representative pictures of original images, binarized images, and fragmented axons from intact and degenerated DRG axons. B, DRG neurons were cultured for 14 d, and the axons were then transected. Representative images of the same fields of axons at the indicated times after axotomy are shown. The time after axotomy is shown above, and the degeneration index is shown below, each image. C, Images from the same field after axotomy were analyzed by two different methods. The bar graph shows the percentage of remaining axons ± SD calculated with the visual rating system used by Araki et al. (2004). The degeneration index calculated from these images was plotted against time after axotomy and displayed as a line graph. The extent of axonal degeneration detected by these two methods is well correlated.
