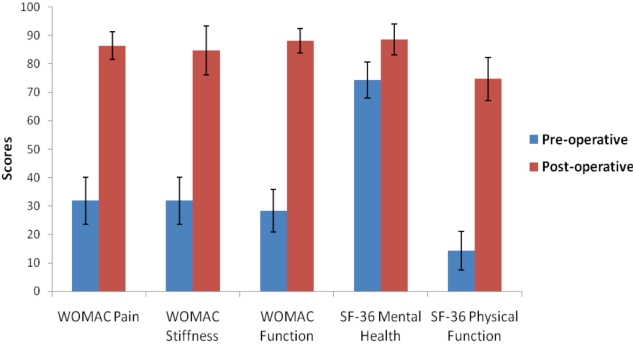
Fig. (1).
Comparison of Pre-op and Post-op Measures. This figure shows pre- and post-operative mean scores for WOMAC pain, stiffness, function and SF-36 Mental Health and Physical Function for the 28 patients surveyed at both time intervals. Pre-operative scores are represented by blue bars and post-operative scores are represented by red bars. Error bars are shown to provide 95% confidence intervals for each of scores.

