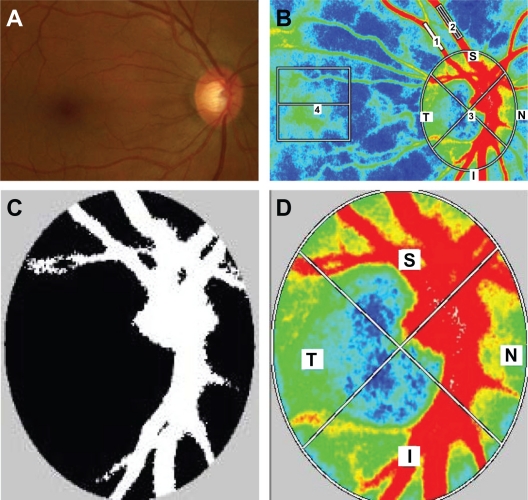
Figure 1.
Representative photographs of a glaucoma patient in this study. (A) Photograph of the fundus. (B) A representative color map produced using LSFG (1, retinal artery; 2, retinal vein; 3, optic disk; 4, choroid). (C) Representative binary format images for segmentation between the vessel (white area) and tissue (black area), obtained using image viewer software with an automated definitive threshold. (D) Orientation of the quadrant assessment for the MBR in the optic disk.

