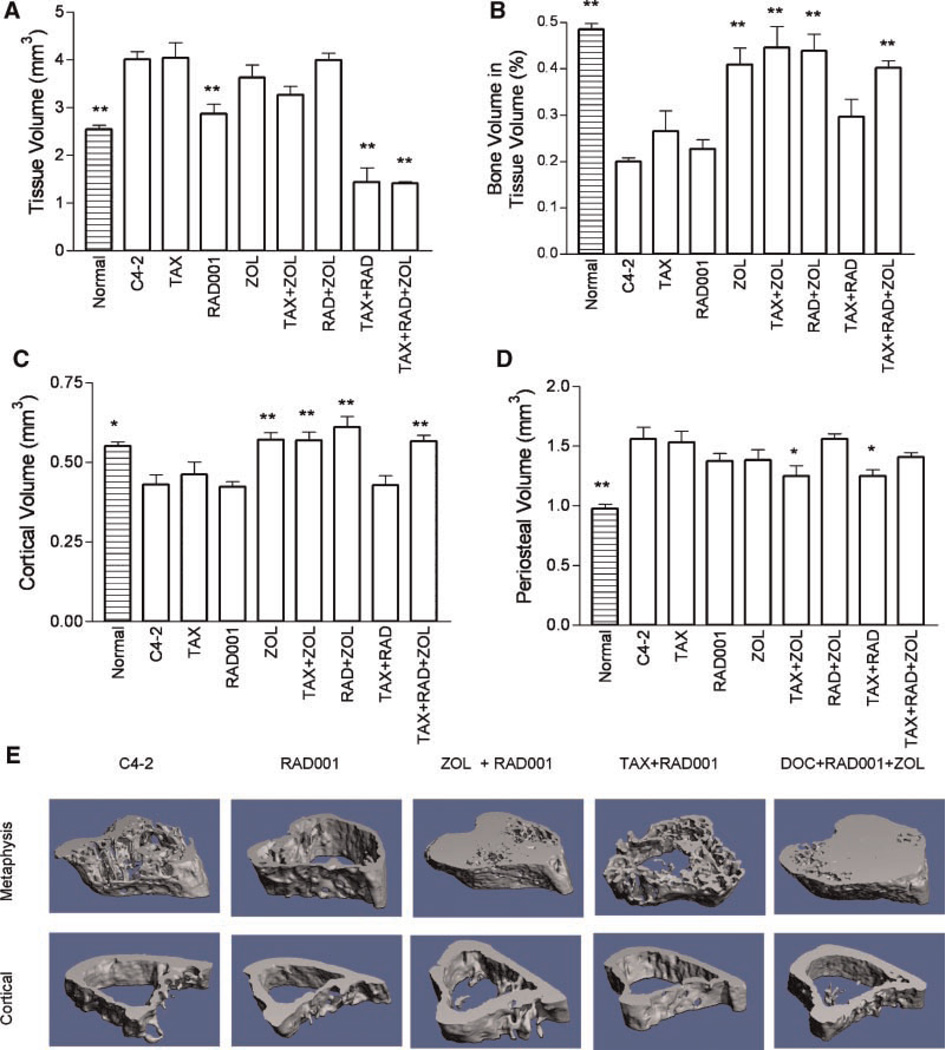
Fig. 4.
Micro-CT analyses. Analysis of the response of the bone to treatment was performed for trabecular bone (metaphysis) and cortical bone. A: Tissue volume at the metaphysis. B: Ratio of bone volume/tissue volume at the metaphysis. C: Cortical bone volume. D: Periosteal volume. Results are plotted as mean ± SEM. Significant differences versus untreated C4-2 xenografts are denoted by:*P < 0.05, **P < 0.01. Also shown for reference in these figures are the parameters of normal untreated tibiae. E: Representative examples of metaphyseal and cortical bone from groups treated with RAD001. [Color figure can be viewed in the online issue, which is available at www.interscience.wiley.com.]

