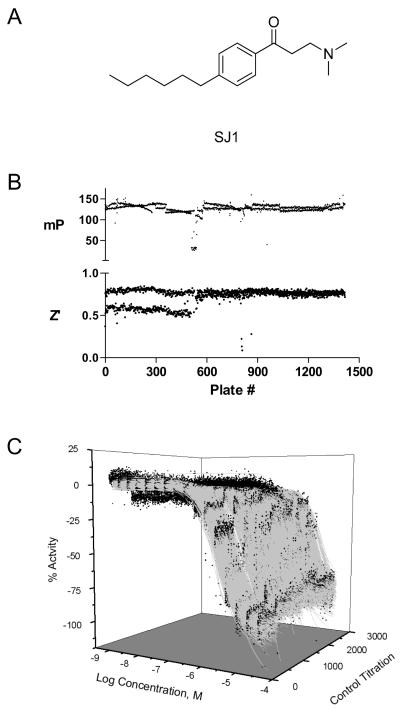
Figure 1. Performance of the quantitative high throughput screen.
A) The structure of the β-aminoketone control inhibitor, SJ1, is shown. B) mP values and Z’ factor of control wells are shown for each plate screened. The bifurcated Z’ scores of the first ~500 plates resulted from a software problem in one of the two EnVision detectors used in the screen. Following correction, the detector configuration was optimized and the Z’ scores aligned with those of the second detector. C) Concentration-response data (black circles) and curve fits (gray lines) of SJ1 titrations from each plate screened is shown. SJ1 was titrated as 16 two-fold titrations in duplicate beginning at 46 uM on each plate.

