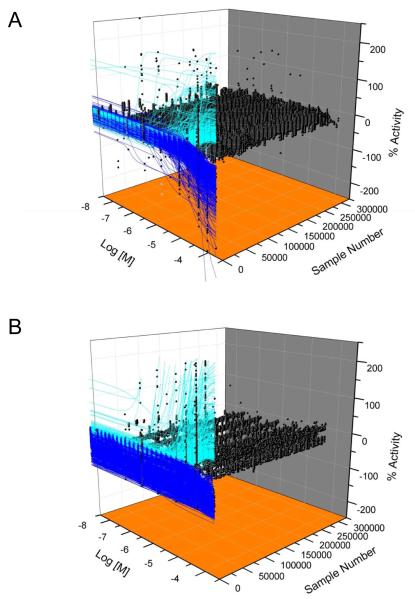
Figure 2. Compound activity of the quantitative high throughput screen.
A and B) Shown are concentration-response data (black circles) and curve fits of compounds with decreasing (blue lines) or increasing (cyan) FP (A) or TF (B) activity. Inactive compounds (black circles only) do not have curve fits.

