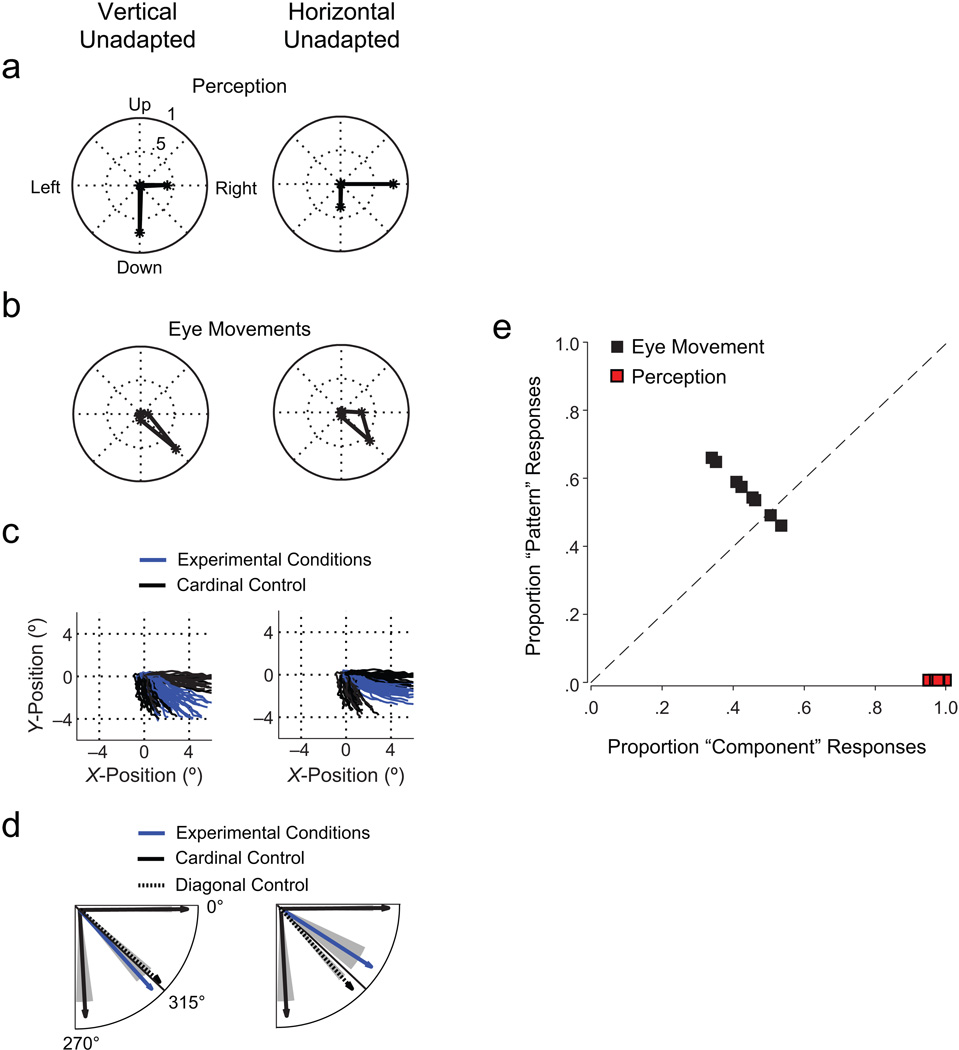
Fig. 3.
Results from Experiment 1 (n = 8). Panels (a) through (d) show results for two example experimental conditions (vertical unadapted: unadapted stimulus moving down and adapted stimulus moving right; horizontal unadapted: unadapted stimulus moving right and adapted stimulus moving down); panel (e) shows results across all experimental conditions. The graph in (a) shows the mean proportions of perceptual judgments in eight directions (number of trials with judgments in a given direction divided by the total number of trials). The length of the line in each direction indicates the magnitude of the proportion. Note that proportions for unadapted-stimulus and adapted-stimulus motion directions add up to more than 1 because more than one motion direction could be indicated. In (b), the proportions of eye movement directions are shown for eight binned intervals. The graph in (c) shows 1 representative observer’s gaze trajectories in experimental conditions and cardinal control conditions (two identical stimuli moving right or down). Panel (d) shows mean eye movement directions for the same experimental and cardinal control conditions as in (c), as well as for diagonal control conditions; shaded areas show standard errors of the mean. Proportions of perceptual judgments and eye movement responses in the component- and pattern-motion directions for each observer are shown in (e).

