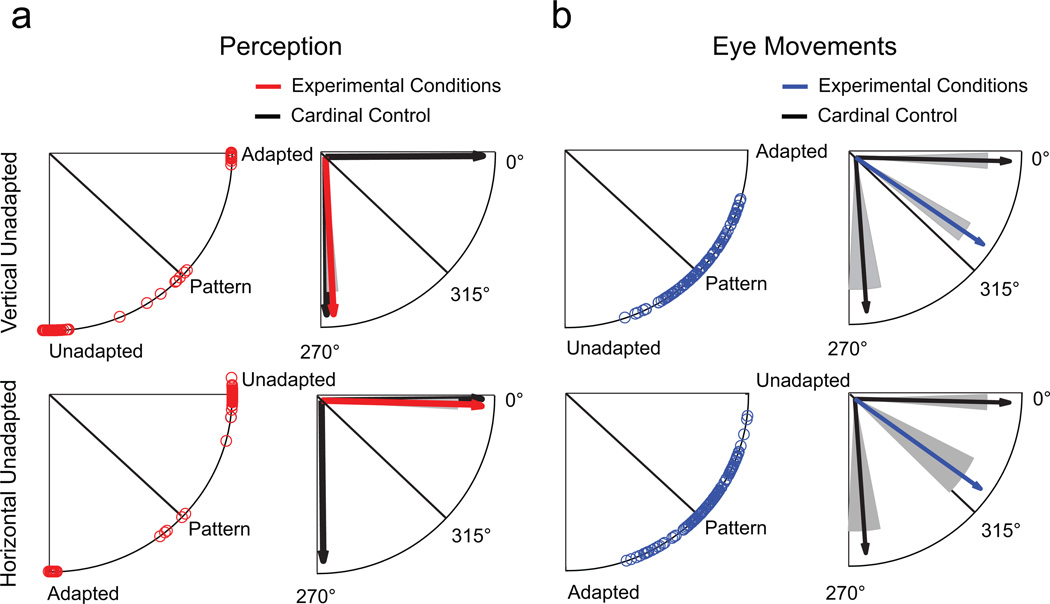
Fig. 4.
Results in Experiment 2 for the same two example conditions as in Figure 3. The upper four illustrations show results for vertically moving unadapted stimuli, and the lower four show results for horizontally moving unadapted stimuli. The circular distribution of individual perceptual responses is shown on the left side of (a), and mean angles for experimental conditions and cardinal control conditions are shown on the right side. The circular distribution of individual eye movement responses is shown on the left side of (b), and mean angles in the experimental conditions and control conditions are shown on the right side. Shaded areas indicate standard errors of the mean.

