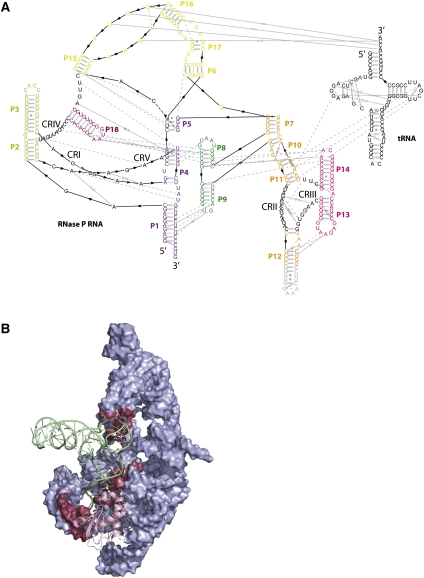
FIGURE 2.
(A) Interactions within the RNase P RNA and between the RNase P RNA and the tRNA represented on an expended secondary structure diagram, permitting a better view of the tertiary interactions (gray symbols). Colors are identical to the schemes described by Reiter et al. (2010). Conserved regions (CRs) are numbered (from I–V), and nucleotides are black type set. (B) Crystal structure of the complex highlighting residues (raspberry surface) from the RNase P RNA (blue surface) that interact with the tRNA (green ribbon). The protein is represented as a pink ribbon.

