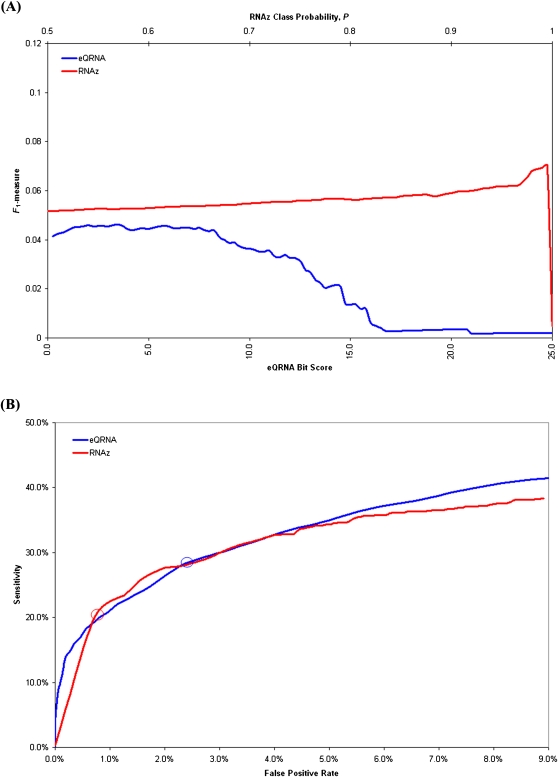
FIGURE 1.
The performance of eQRNA as a function of its bit score and of RNAz as a function of its class probability score are shown when evaluated on 776 putative sRNAs. Each line represents 100 points, and each point represents the performance of a tool based on predictions at or above a score threshold. For eQRNA, 100 bit score thresholds between 0.0 and 25.0 were used. For RNAz, 100 class probability, P, thresholds between 0.5 and 1.0 were used. False positive rates were determined by rerunning each tool on shuffled alignments (see Materials and Methods). (A) The line graphs indicate the performance of eQRNA and RNAz, as determined by the F1-measure, at 100 different score thresholds. For eQRNA, the bit scores are shown on the lower x-axis, and for RNAz, the class probabilities are shown on the upper x-axis. eQRNA achieves maximum performance when predictions are restricted to those with a bit score ≥3.5. RNAz achieves maximum performance when predictions are restricted to those with a class probability ≥0.995. (B) The ROC curves illustrate the trade-offs between sensitivity and false positive rate at 100 different score thresholds for each of eQRNA and RNAz. The circle on each curve represents the point at which the F1-measure in A achieves a maximum value.

