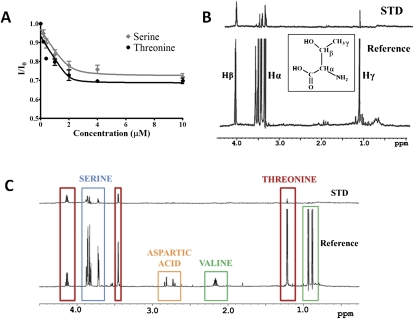
FIGURE 4.
Changes in fluorescence of YrdC with additions of the amino acids threonine and serine (A) and STD-NMR of threonine in the presence of YrdC (B). The one-dimensional reference spectrum with 1 mM threonine (bottom) and the STD spectrum (top). (C) Competition of amino acids in binding to YrdC. The STD-NMR experiment was conducted with YrdC and equal molar concentrations of serine (blue), threonine (red), aspartic acid (orange), and valine (green).

