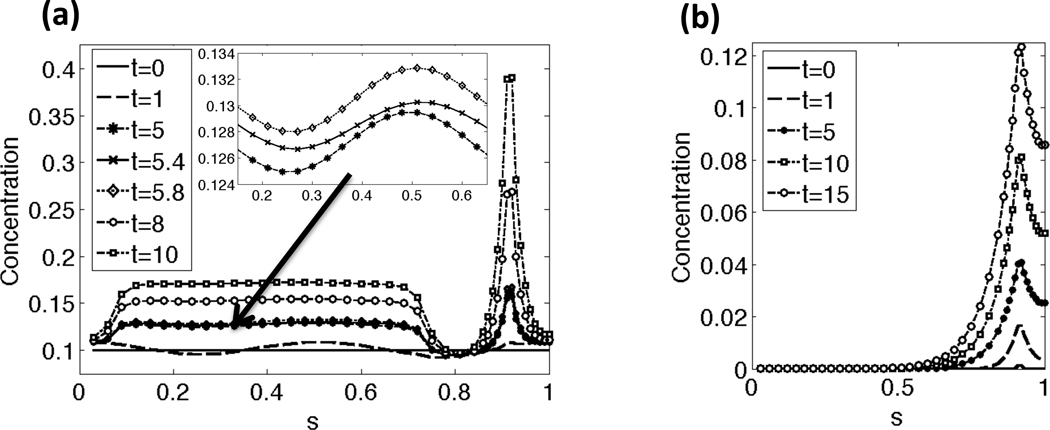
Fig. 3.
Concentration along the length of the flagellum for a few time points: (a) Ca2+ concentration, (b) IP3 concentration. In (a), the Ca2+ concentrations starts at a resting level and then increases in the principal pieces as the CatSper channels open. When the Ca2+ and IP3 concentration reach a threshold concentration, the RNE in the neck releases additional Ca2+. The arrow and inset zooms in on the Ca2+ concentrations in the principal piece at time points t = 5, 5.4, and 5.8. Note that the Ca2+ concentration has small oscillations in concentration due to the local stretching and compression of the flagellum, as accounted for in the left hand side of Eq. (18a). Note that the sperm is divided into the following regions: end piece s = 0 − 0.07, principal piece s =0.07–0.73, midpiece s = 0.73−0.9, neck s = 0.9−0.92, and the head s = 0.92−1. This simulation had a constant tensile stiffness S1 and kA=0.3 if ζ(s, t) > 0 and kA = 0.5 if ζ(s, t) < 0.

