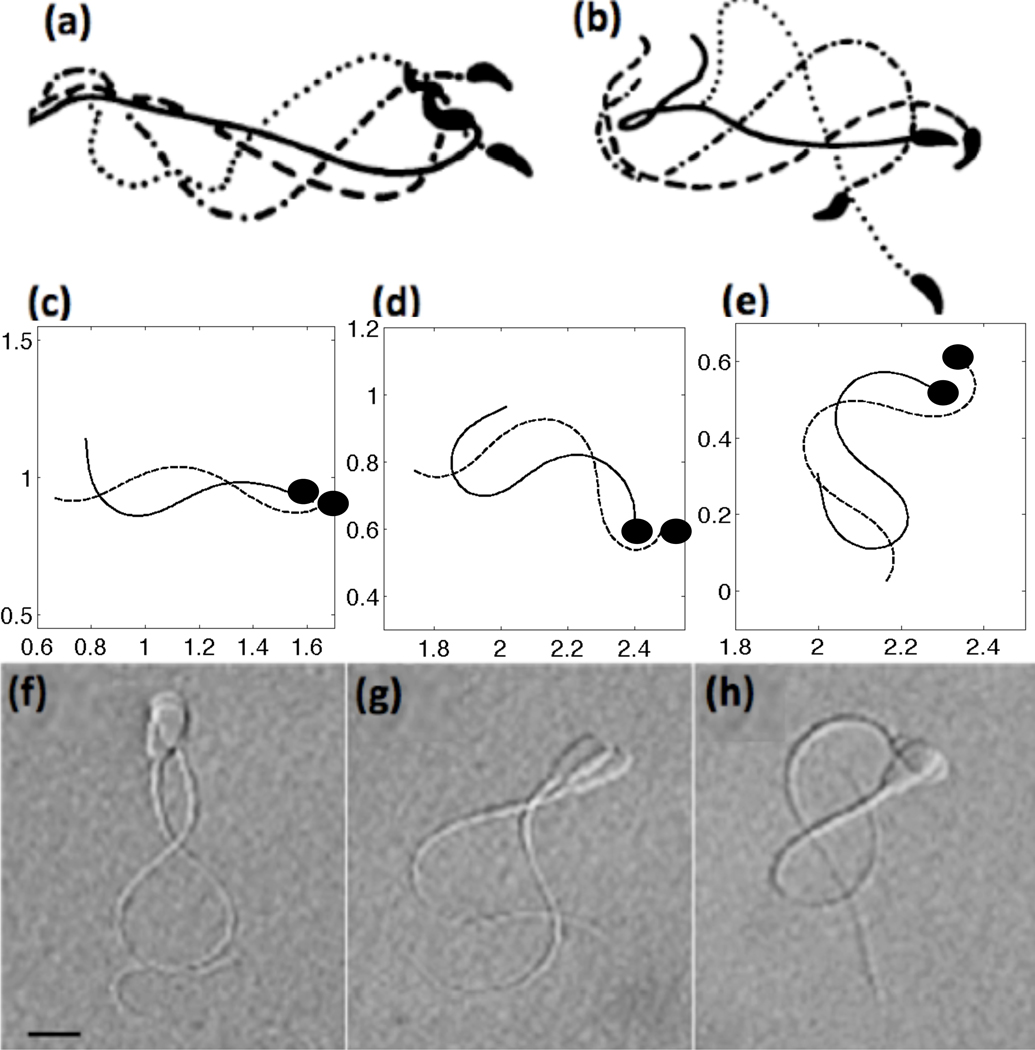
Fig. 6.
Top row: tracings of flagellar bending patterns of (a) activated and (b) hyperactivated motility of mouse sperm where the four tracings cover one full beat, reproduced with permission from [72]. Middle row: simulated results of computational model including CatSper mediated Ca2+ dynamics showing (c) activated (t = 5 nondimensional), (d) hyperactivated (t = 35), (e) and fully hyperactivated motility (t = 75) where the tracings are 1/4 of a beat apart with the dashed line the later time point. For these simulations, a 4th order taper of tensile stiffness S1 was used and kA=0.3 if ζ(s, t) > 0 and kA = 0.5 if ζ(s, t) < 0. The solid black circle denotes the head side of the flagellum. Bottom row: in comparison, images of bull sperm swimming patterns (~ 50 µm in length) for (f) activated, (g) hyperactivated, (h) and fully hyperactivated motility where each of the images are approximately 1/4 of a beat apart, reproduced with permission from [71]

