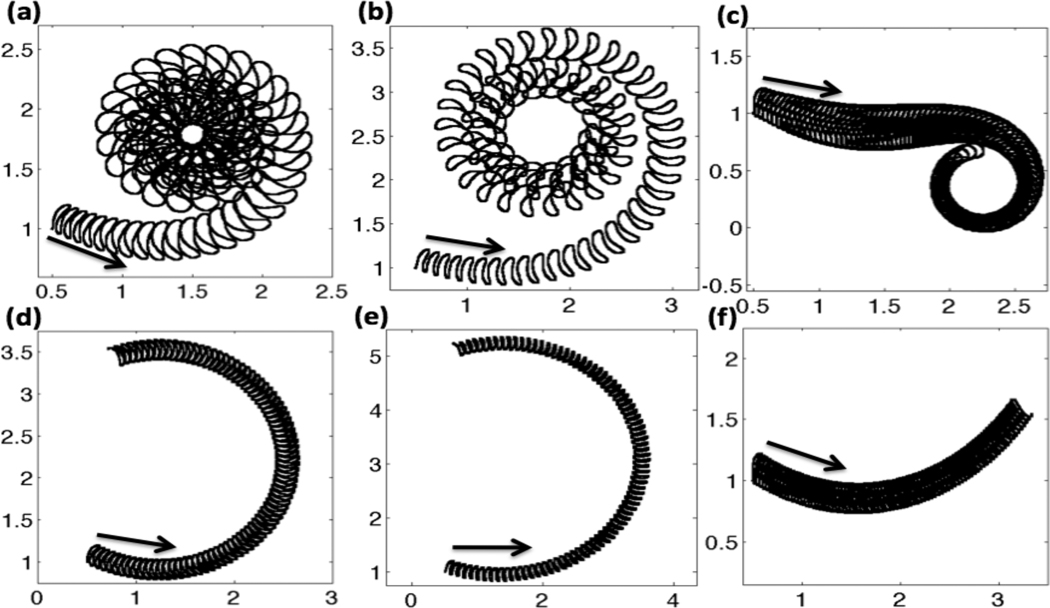
Fig. 7.
Trajectories of the last immersed boundary point at the end of the flagellum for nondimensional time t =0–85. Top row: with CatSper mediated Ca2+ dynamics, (a) constant S1, (b) linear taper of S1, (c) fourth order taper of S1. Bottom row: no CatSper mediated Ca2+ dynamics, i.e. with constant resting level of Ca2+ concentration, (d) constant S1, (e) linear taper of S1, (f) fourth order taper of S1. Arrows denote initial starting location and initial direction. All simulations are with kA=0.3 if ζ(s, t) > 0 and kA = 0.5 if ζ(s, t) < 0.

