Figure 5.
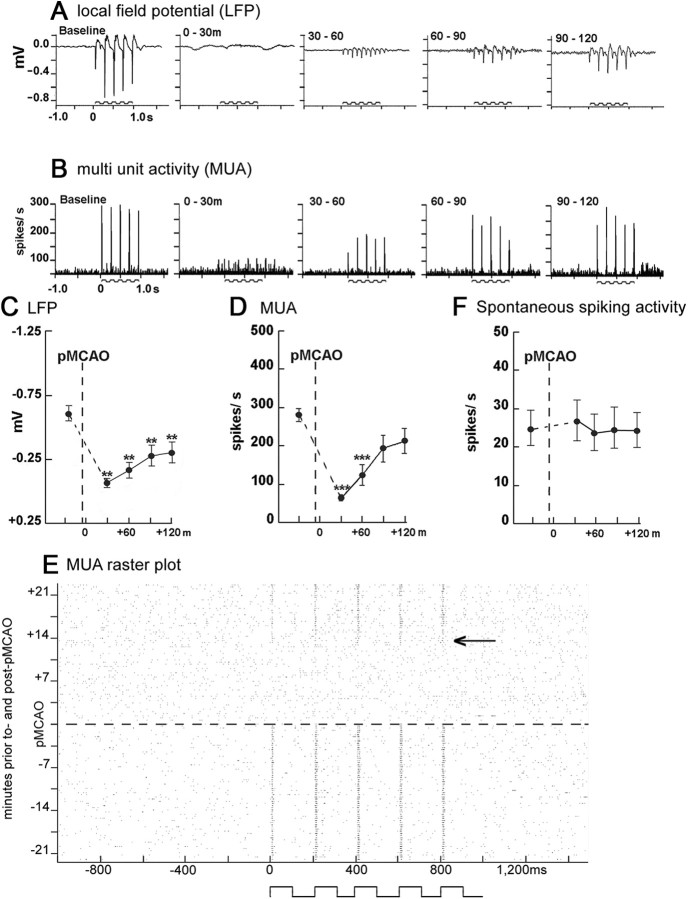
Evoked neuronal activity was suppressed following pMCAO and reestablished during whisker stimulation treatment in +0 h animals. A, B, Representative +0 h animals' LFP (A) and MUA (B) responses at baseline and during the stimulus period following pMCAO. Stepping function indicates stimulus delivery. C, D, F, Evoked LFP (C), evoked MUA (D), and spontaneous spiking activity (F) mean and SE is plotted preocclusion and postocclusion. Asterisks indicated a significant difference from baseline: **p < 0.01 and ***p < 0.001. E, Representative multiunit raster plot recorded ∼21 min before and after pMCAO (∼21 min are required to collect one full 64 stimulus trial block). x-Axis represents 1000 ms of spontaneous activity, 1000 ms of evoked activity (whisker stimulation indicated by step function), and 500 ms of spontaneous activity. Arrow indicates the approximate point at which evoked MUA responses begin to return.

