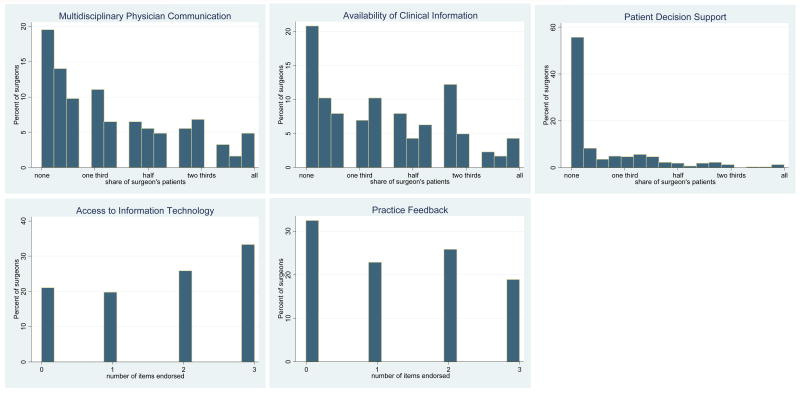
Figure 1.
The figures show the distribution of surgeon scores for each of the five patient and practice management measures. The x-axis scale values for the communication, information, and support variables are the share of individual surgeon's patients (averaged across the items in each scale) who received the given practice process (interval measure from 1 none or very few patients to 5 almost all patients); the x-axis values for the information technology and feedback variables indicate the number of items in each scale endorsed by surgeons (totaling up to 3).

