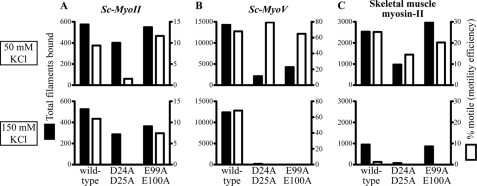
FIGURE 7.
Comparing actin filament binding and motility efficiencies for Sc-MyoII, Sc-MyoV, and skeletal muscle myosin-II using the in vitro motility assay. The total number of filaments bound (■), and percentage of bound filaments undergoing motility (□) were quantified for Sc-MyoII (A), Sc-MyoV (B), and muscle myosin-II (C). Filament totals were scored at three set positions (i.e. three 130 μm2 fields) along the motility chamber. As in Fig. 6, yeast actins (wild-type, D24A-D25A, and E99A-E100A) were assayed at two different salt concentrations (50 mm KCl: upper plots; 150 mm KCl: lower plots). 25 nm actin filaments were employed throughout.

