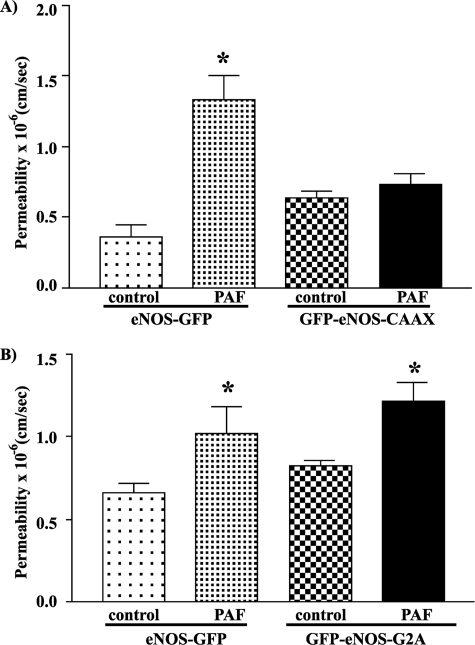
FIGURE 4.
Permeability measurements in ECV-304 cells transfected with different targeted eNOS constructs. Permeability data are expressed as paired bars expressing mean permeability ± S.E. for the base line and after 100 nm PAF. A and B illustrate independent experiments. A, ECV-GFP-eNOS-CAAX cells did not increase permeability in response to PAF (n = 3). B, ECV-GFP-eNOS-G2A cells showed a significant increase in permeability in response to PAF (n = 6). *, p < 0.05.

