FIGURE 4.
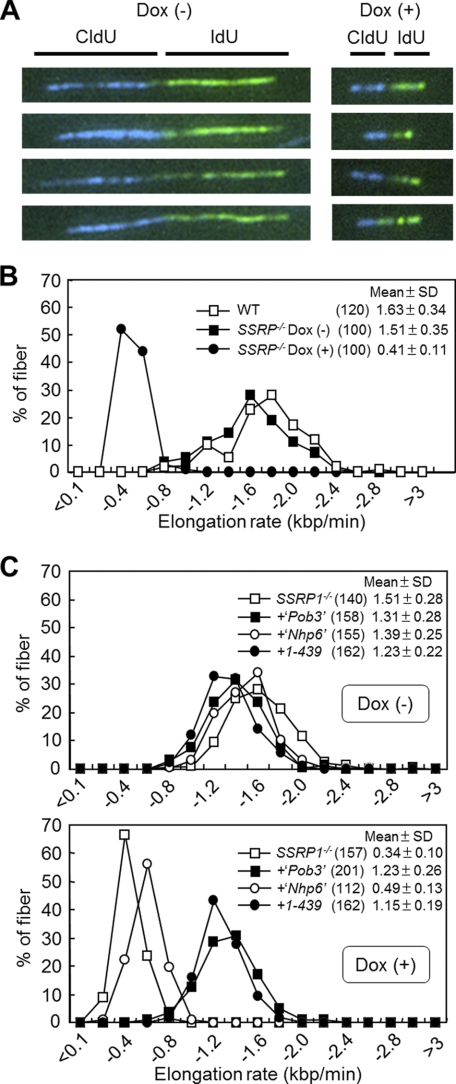
Analysis of DNA replication elongation. A, images of typical DNA fibers. SSRP−/− cells cultured in the presence (+) or absence (−) of Dox for 48 h were successively pulse-labeled with CldU (blue) and IdU (green). DNA fibers were stained as described under “Experimental Procedures.” B, DNA replication elongation rates as determined by the percentage of DNA fibers containing CldU. The lengths of DNA fibers (only CldU tracks that connected with IdU tracks) prepared as shown in A were measured, and DNA replication elongation rates (mean ± S.D.) were calculated as fiber length divided by pulse-labeling time. Results using wild-type cells are also shown. The numbers in parentheses indicate the number of samples tested. C, fork rates in SSRP1−/− cells expressing SSRP1 fragments. Cells were cultured in the presence (+) or absence (−) of Dox for 48 h and successively pulse-labeled with CldU and IdU. Only CldU tracks that connected with IdU tracks were measured. Fork rates were calculated and are displayed as mean ± S.D. The numbers in parentheses indicate the number of samples.

