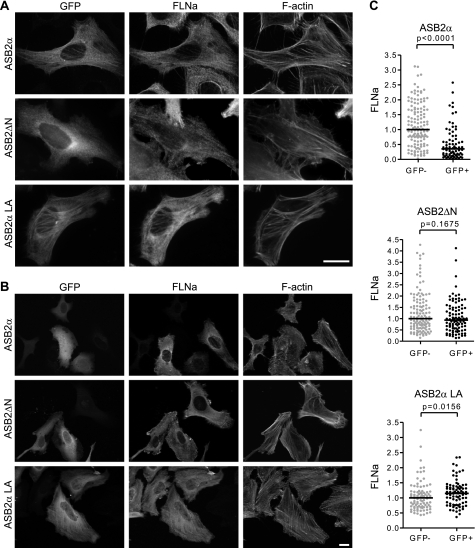
FIGURE 3.
ASB2α residues 1–20 encompass a major determinant for ASB2α colocalization with FLNa and subsequent degradation. A and B, HeLa cells were transfected with GFP-ASB2α, GFP-ASB2αLA, or GFP-ASB2ΔN expression vectors and analyzed 8 (A) and 48 h (B and C) after transfection using an antibody against FLNa. C, dot plots show relative FLNa fluorescence intensities of GFP negative (gray) and GFP positive (black) cells measured using the Axiovision software. p values were calculated with the Mann-Whitney t test. Scale bar represents 20 μm.

