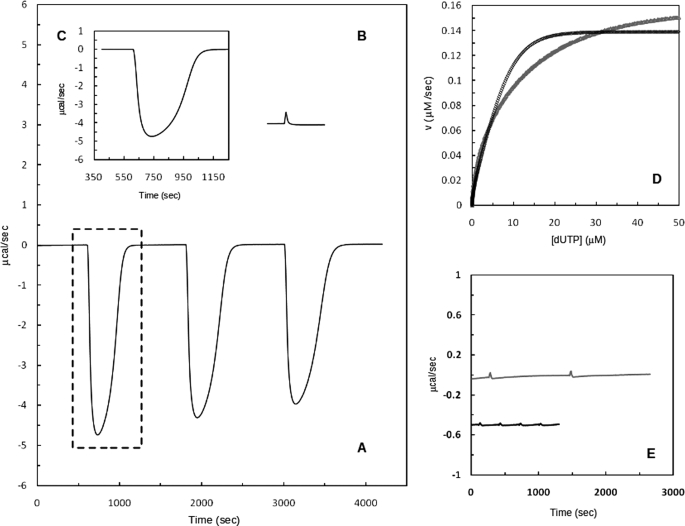
FIGURE 7.
DR2231-catalyzed hydrolysis of dUTP in 20 mm Tris-HCl, 5 mm NaCl, 25 mm MgCl2 at pH 7.0 and 25 °C. A, representation of typical calorimetric trace (μcal versus time) obtained after the addition of three injections of 3 mm dUTP (20-μl injections) to the calorimetric cell containing DR2231 (12.5 nm). Change in instrumental thermal power was monitored until substrate hydrolysis was complete, returning to the original base line. B, thermogram of the dUTP dilution experiment. C, calorimetric trace (first injection) resulting after subtraction of the first peak of the dilution experiment. D, net thermal power (from B) was converted to rate and substrate concentration and fit to the Michaelis-Menten equation (black curve); the gray curve corresponds to a similar assay but in the presence of 25 mm MnCl2 (see “Experimental Procedures”). E, raw data representing the calorimetric trace (gray line) of 20-μl injections of 3 mm dTTP into the calorimetric cell containing enzyme (12.5 nm) and the equivalent dilution experiment in the absence of enzyme (black line). The trace of the dilution experiment is shifted for clarity.

