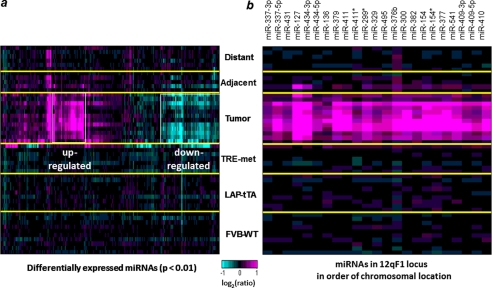
FIGURE 1.
miRNA expression profile in the c-Met mouse model of HCC. a, tumor samples show the greatest changes in miRNA expression. miRNAs with significant expression changes in at least one sample (p < 0.01) are shown. Yellow lines separate the sample groups, and white boxes highlight the up- and down-regulated miRNAs in tumors. FVB-WT, liver tissue from control animals; LAP-tTA and TRE-met, liver tissue from single transgene parental strains; Tumor, tumor tissue from double transgene, tumor-bearing animals; Adjacent/Distant, non-tumor liver tissue from double transgene, tumor-bearing animals. b, expression pattern of 23 miRNAs from the mouse 12qF1 chromosomal cluster.

