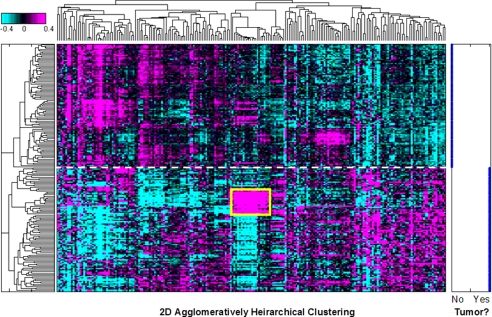
FIGURE 2.
Global view of 220 miRNA expression patterns in tumor and non-tumor clinical tissues from human HCC. A heat map shows two-dimensional unsupervised clustering of log10 expression ratios for 220 human miRNAs in 97 pairs of tumor and adjacent non-tumor HCC tissues. miRNA expression levels were normalized to the mean of all samples. A cluster of coordinately up-regulated miRNAs from the DLK1-DIO3 region is boxed in yellow. The degree of up-regulation is shown in magenta, and down-regulation is shown in cyan on a log scale as indicated by the color bar. Separation by clustering of tumor and adjacent non-tumor samples is indicated by the dashed white line. Right, tumor status of each sample. No, adjacent non-tumor; Yes, HCC.

