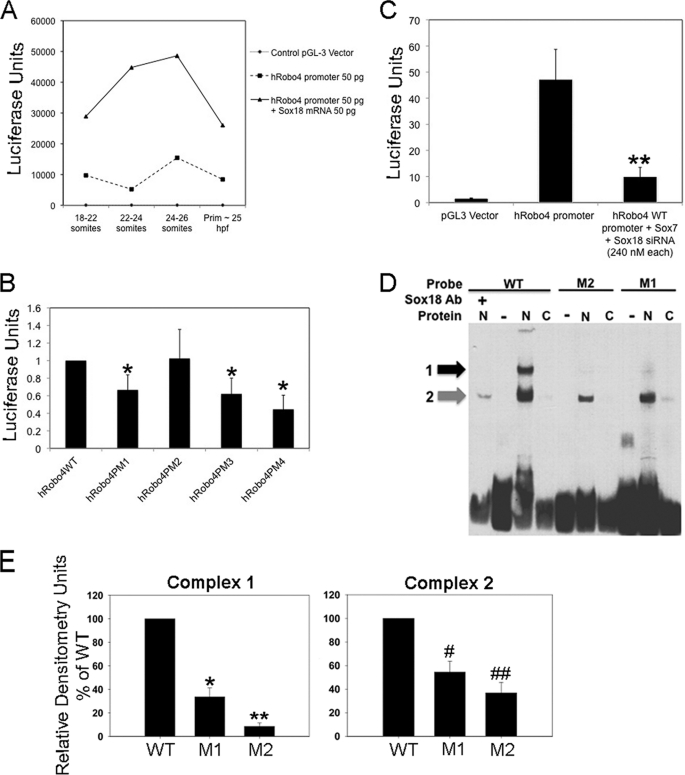
FIGURE 3.
Robo4:Sox7/18 transcriptional regulation. A, graphical representation of Sox18-induced ROBO4 promoter activity in vivo. Details of the experimental design are provided under “Experimental Procedures.” Dotted line denotes the base-line exogenous ROBO4 promoter activity. Black line denotes exogenous ROBO4 promoter activity in sox18 overexpression (sox18 mRNA) embryos. Line along the x axis indicates empty control pGL3 vector-injected embryos. The graph is a representative experimental data set, and each time interval contained 20–25 embryos. This experiment was performed twice with identical trends, and error bars have not been provided due to the high variation in the luciferase values from one experiment to the next. B, in vitro luciferase assays in HUVECs for ROBO4 promoter point mutants (PM1–4) compared with h ROBO4 WT promoter. Error bars represent S.E. from three independent experiments, and all luciferase values are shown as -fold compared with h ROBO4 WT promoter sample. All sample groups were compared with h ROBO4 WT promoter groups, and all samples except h ROBO4PM2 were statistically significant at *p < 0.05. C, ROBO4 promoter activity in control (lacZ siRNA) and Sox7 and Sox18 knockdown (Sox7 + Sox18 siRNA) ECs. B and C, HUVECs transiently transfected with WT-Robo4 and Robo-4 PM1–4 (four mutants) constructs or WT h ROBO4 promoter (1.5 μg) and lacZ and Sox7 + Sox18 siRNA (240 nm each) for 36 h and promoter activity determined as a function of luciferase activity. Luciferase (firefly) readings were normalized to the control, and data from three independent experiments are compiled together. **, p < 0.05 was determined by two-tailed statistical analysis. D, EMSA of DNA binding reactions with Sox18 mutant (M1 and M2) and WT probes incubated with nuclear (N) or cytoplasmic (C) proteins from ECs, in the presence or absence of SOX18 antibody (Ab). The black and gray arrows indicate the shifted complex 1 and 2, respectively. Complex 1, top band (black arrow), is diminished in intensity in mutant M1 probe N lanes and is absent in mutant M2 probe and wild-type probe plus Ab lanes. E, chemiluminescence values of the complex 1 and 2 bands (arbitrary unit) measured by Fluor Chem HD and band intensities of the two complexes in M1 and M2 probe EMSA relative to WT probe EMSA. Data are from three independent EMSA reactions, and error bars represent S.E. (Complex 1 M1: *, p = 0.0009; M2: **, p = 0.0001; Complex 2 M1: #, p = 0.0076; M2: ##, p < 0.0018).

