Abstract
Mitochondrial TCA cycle dehydrogenase enzymes have been shown to be stimulated by Ca2+ under various substrate and ADP incubation conditions in an attempt to determine and understand the role of Ca2+ in maintaining energy homeostasis in working hearts. In this study, we tested the hypothesis that, at physiological temperature and 1 mm extramitochondrial free magnesium, Ca2+ can stimulate the overall mitochondrial NAD(P)H generation flux in rat heart mitochondria utilizing pyruvate and malate as substrates at both subsaturating and saturating concentrations. In both cases, we found that, in the physiological regime of mitochondrial oxygen consumption observed in the intact animal and in the physiological range of cytosolic Ca2+ concentration averaged per beat, Ca2+ had no observable stimulatory effect. A modest apparent stimulatory effect (22–27%) was observable at supraphysiological maximal ADP-stimulated respiration at 2.5 mm initial phosphate. The stimulatory effects observed over the physiological Ca2+ range are not sufficient to make a significant contribution to the control of oxidative phosphorylation in the heart in vivo.
Keywords: Calcium, Cardiac Metabolism, Mitochondrial Metabolism, NADH, Respiration, Tricarboxylic Acid (TCA) Cycle
Introduction
Mitochondria synthesize ATP by oxidative phosphorylation in response to cellular ATP demand, thereby maintaining the cytosolic phosphorylation potential to drive a variety of processes coupled to ATP hydrolysis. One of the central questions in cardiac physiology is the nature of the mitochondrial response to changes in cellular ATP demand, i.e. whether feedback from products of ATP hydrolysis is sufficient to explain observed phenomena in cardiac phosphoenergetics at various levels of work (1). On the basis of the apparent stability of creatine phosphate/ATP and Pi over a wide range of workloads, Balaban et al. (2, 3) postulated that this apparent stability is due to a “positive feedback” mechanism enabling mitochondrial response to match the demand. More properly, such a mechanism would be an example of open-loop control, where parallel Ca2+-dependent pathways would stimulate ATP utilization and synthesis. Cytosolic free Ca2+, which is a signal coupling cardiac electrical excitation to mechanical contraction, thereby increasing ATP demand, was identified as a putative open-loop controller activating mitochondrial matrix dehydrogenases and F1F0-ATPase in studies on isolated mitochondria utilizing glutamate/malate (4) or 2-oxoglutarate alone (5, 6) as substrate, whereas pyruvate is a physiological substrate entering the terminal oxidative pathway in the mitochondrial TCA cycle. In this study, we measured the respiration and redox responses of mitochondria to extramitochondrial free Ca2+ when utilizing the physiological substrates pyruvate and malate at saturating, physiological, and subphysiological concentrations at physiological temperature and free magnesium (Mg2+) concentration. We tested the hypothesis that an increase in Ca2+ concentration could support higher respiration without a reduction in NAD(P)H concentration over the physiological range for respiration rates or a higher NAD(P)H concentration at a given respiration rate. Previous studies (4, 6) have been restricted to substrates that provided the maximal calcium effect. The major point of this study was to examine the effect of calcium on mitochondrial respiration and NAD(P)H using pyruvate, which is the product of glycolysis entering the terminal oxidative pathway in mitochondria.
Neither the respiration and NAD(P)H production rates nor the observed redox levels showed any apparent stimulatory effect of external Ca2+ over an average concentration range observed in isolated trabeculae and cells at physiological temperature and stimulation frequencies (7, 8). Over a range of substrate concentration and at high initial Pi, only a 22–27% stimulatory effect on maximal State 3 respiration (which is never attained in vivo) was observed without a significant change in the corresponding NAD(P)H fraction.
MATERIALS AND METHODS
Isolation of Mitochondria
Mitochondria were isolated from the hearts of 12–14-week-old Dahl/SS rats using protocols that were approved by the Institutional Animal Care and Use Committee at the Medical College of Wisconsin. The rats were anesthetized with an intraperitoneal injection of pentobarbital. After the animal was in the deep plane of anesthesia, the ventricles of the heart were excised and immediately placed in ice-cold isolation buffer containing 200 mm mannitol, 50 mm sucrose, 5 mm KH2PO4, 5 mm MOPS, 1 mm EGTA, and 0.1% BSA. The ventricles were minced, added to 2.5 ml of a solution of 5 units/ml protease (Bacillus licheniformis), and homogenized for 1 min in a cold room. Isolation buffer was added to the homogenate to a final volume of 25 ml and centrifuged at 8000 × g for 10 min to remove the protease. The supernatant was discarded, and the pellet was resuspended in isolation buffer to 25 ml and centrifuged at 700 × g. The pellet was discarded, and the supernatant was centrifuged at 700 × g. The pellet from the previous step was discarded, and the supernatant was centrifuged at 8000 × g. The pellet, which contained the mitochondrial fraction, was resuspended in 0.5 ml of isolation buffer, and the protein concentration was quantified in terms of an equivalent BSA concentration using the Bio-Rad Quick Start Bradford assay kit (9).
Respirometry and Testing Functional Integrity of Isolated Mitochondria
The functional integrity of the mitochondria was determined by means of respiratory control indices defined as the ratio of State 3 to State 4 respiration upon addition of ADP at a final concentration of 375 μm at 37 °C. Respiration measurements at saturating substrate concentrations were performed using a Clark-type electrode (Mitocell S200, Strathkelvin Instruments Ltd.) with mitochondria suspended at a concentration of 0.5 mg/ml in pH 7.2 buffer containing 130 mm KCl, 2.5 mm K2HPO4, 20 mm MOPS, 1 mm EGTA, and 0.1% BSA. Mitochondrial preparations with respiratory control indices >6 with 10 mm sodium pyruvate and 10 mm potassium malate as substrates were considered to be of acceptable quality for our experiments. Mitochondrial respiration was also measured in the presence of 1 mm free Mg2+. State 4 respiration was much higher in the presence of Mg2+ due to ADP generation from extramitochondrial ATPases hydrolyzing MgATP, similar to the observations of Bishop and Atkinson (10). Respiration measurements at limiting substrate concentrations were made using a high resolution respirometer (Oxygraph 2k, Oroboros Instruments GmbH, Innsbruck, Austria).
Measurement of Mitochondrial NAD(P)H Fluorescence during a State 2-3-4 Transient
NAD(P)H fluorescence was recorded at 470 nm with excitation at 350 nm and a 12-nm bandwidth in a multimode plate reader equipped with reagent dispensers (Varioskan Flash, Thermo Scientific) with the samples placed in 24-well microplate wells with thermal incubation to maintain the sample temperature at 37 °C. The maintenance of sample temperature at 37 °C during the course of an experiment, from the introduction of the sample into the plate reader until the end of the experiment, was verified by testing our protocol in a 24-well microplate custom-instrumented with a microthermistor (10 kiloohms QTUT-14C3, Quality Thermistor, Inc). Substrates and ADP were dispensed in the microplate wells using the automated reagent dispensers.
At the start of a fluorescence time course recording, mitochondria were suspended in a microplate well in 1 ml of preheated experimental buffer to obtain a final concentration of 0.5 mg/ml protein. NAD(P)H fluorescence was recorded every 3.5 s, and the samples were kept well mixed by 600 shakes/min (orbital shaking) between successive readings. A time course recording consisted of the following events: 1) 0 s, introduction of the sample into the plate reader and start of recording; 2) 70 s, addition of substrate; 3) 164.5 s, addition of ADP; 4) 514.5 s, addition of rotenone or carbonyl cyanide p-trifluoromethoxyphenylhydrazone; and 5) 654.5 s, end of recording.
Substrates were added as 10-μl aliquots of stock solutions to the 1-ml mitochondrial suspension to reach the desired final concentrations. ADP was added as a 15-μl addition of a 25 mm stock solution (375 μm final concentration) when saturating substrate concentrations were used or as a 7-μl addition of the same stock solution (175 μm final concentration) when limiting substrate concentrations were used. The saturating concentration for pyruvate/malate was 10 mm for both components, and the limiting concentrations were 0.1 mm pyruvate and 0.25 mm malate. The saturating concentration for 2-oxoglutarate was 5 mm, and the limiting concentration was 0.5 mm with 1 mm malate. The recorded time courses of NAD(P)H fluorescence were normalized with respect to maximally reduced (obtained after rotenone addition) and oxidized (obtained after carbonyl cyanide p-trifluoromethoxyphenylhydrazone addition) states to express them on a percentage scale of NAD(P) reduction.
Control of Extramitochondrial Free Buffer Ca2+ Concentrations
[Ca2+]e was controlled by using appropriate amounts of total added Ca2+, calculated by solving multiple cation equilibrium equations based on temperature-corrected dissociation constants from Tsien and Pozzan (11) for the given amount of EGTA and other components in the experimental buffer. The correspondence between total added Ca2+ and Ca2+e is given by 0 μm to 0 nm, 300 μm to 50 nm, 450 μm to 100 nm, 630 μm to 200 nm, and 750 μm to 350 nm. The calculated [Ca2+]e values are subject to <5% uncertainty due to a 1% uncertainty in the stability constants or 0.01 pH unit uncertainty in the measured pH. The [Ca2+]e range was designed to include a nominally zero level of Ca2+, the typical Ca2+ level in a resting myocyte (100 nm), and the Ca2+ level averaged over a beat (350 nm) in a myocyte stimulated at heart rates achievable in the intact animal (7, 8). The measurements of Dibb et al. (7) showed an average Ca2+ concentration of 361.5 nm at 6 Hz in isolated myocytes (control group), and those of Ward et al. (8) showed an average Ca2+ concentration of 300 nm at 5 Hz in isolated trabeculae. Experiments were also performed at [Ca2+]e > 750 nm with limiting pyruvate/malate.
Data Analysis and Characterization of NAD(P)H Transient Shape Parameters
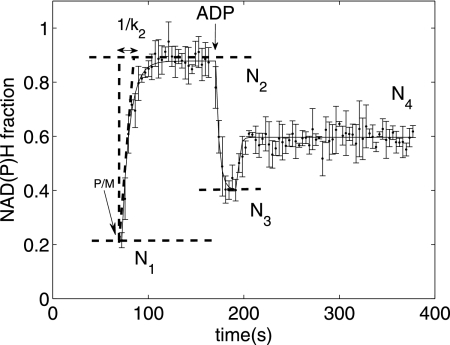
Fig. 1 shows a typical normalized NAD(P)H fluorescence transient obtained during the course of the experiment described above with 2.5 mm initial Pi. The normalization converts the fluorescence recording into fraction of NAD(P)H in the total NAD(P) + NAD(P)H pool based on a linear scaling between the fully reduced end point obtained by addition of the Complex I blocker rotenone and a fully oxidized end point obtained by addition of the uncoupler carbonyl cyanide p-trifluoromethoxyphenylhydrazone. The increase of the NAD(P)H fraction after addition of substrate was fitted to an exponential function, N2 + (N1 − N2)exp(−k2t2), where N1 is the initial normalized fluorescence at the beginning of State 2, N2 is the normalized fluorescence toward the end of State 2, k2 is the rate constant of reduction of NAD(P) into NAD(P)H (which is a measure of the flux through the TCA cycle dehydrogenases generating NAD(P)H)), and t2 is the time during the State 2 segment. Note that our definition of State 2, as an approximate steady state in respiration rate and NAD(P)H level attained after addition of substrate in the presence of Pi to the buffer, differs from that of Chance and Williams (12). The standard deviations of N2 and k2 were estimated using a local sensitivity-based method described by Landaw and DiStefano (13). The maximally oxidized state N3 following ADP addition was recorded as the minimal normalized NAD(P)H fluorescence value during State 3. The normalized State 4 NAD(P)H fluorescence N4 was calculated by averaging 10 normalized fluorescence readings at the end of the State 4 recording. In the presence of 1 mm Mg2+, N4 attained a value between N2 and N3 due to the presence of the magnesium-dependent ATP hydrolysis reaction. When Mg2+ was not added to the buffer, N4 recovered to the N2 value, and the State 4 respiration rate equaled the State 2 rate (data not shown). Thus, with 1 mm Mg2+, the observed State 4 represents a mitochondrial ATP synthesis rate roughly halfway between the minimal and maximal in vivo rates.
FIGURE 1.
NAD(P)H transient during a State 2-3-4 transition (at 2. 5 mm initial buffer Pi and 100 nm Ca2+e) normalized on a scale of 0–1, with 1 representing the fully reduced state and 0 representing the fully oxidized state based on rotenone and carbonyl cyanide p-trifluoromethoxyphenylhydrazone end points, respectively (see “Materials and Methods”). Shown is the time course of normalized NAD(P)H upon addition of 10 mm pyruvate and 10 mm malate as substrates at 70 s, leading to the development of State 2 (fitted to an exponential function with rate constant k2 and a final NAD(P)H fraction of N2), which is followed by addition of 375 mm of ADP at 164.5 s, leading to maximal oxidation of NAD(P)H (N3) in State 3, followed by recovery to State 4 (N4).
RESULTS AND DISCUSSION
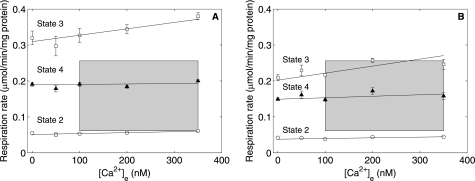
Mitochondrial respiration and NAD(P)H fluorescence were measured at 0, 50, 100, 200, and 350 nm Ca2+e and 1 mm free Mg2+ buffered by EGTA under State 2 conditions (after addition of 10 mm pyruvate/malate), under State 3 conditions (the maximally stimulated respiration reached upon addition of 375 μm ADP); and under State 4 conditions (the steady-state respiration achieved after State 3 due the presence of ATPases catalyzing the hydrolysis of MgATP) (10). These measurements were conducted at two initial buffer Pi concentrations: 0.5 mm (near the resting physiological level) and 2.5 mm (near the maximal level, which may be attained at very high workloads) (14). The physiologically achievable myocardial oxygen consumption rate range of 73–305 μl/min/g (wet weight) (15) corresponds to a mitochondrial oxygen consumption rate range of 0.0613–0.2559 μmol/min/mg of mitochondrial protein calculated by using data on myocardial composition and water spaces from Vinnakota and Bassingthwaighte (16). Fig. 2 (A and B) shows the relationship between [Ca2+]e and State 2, 3, and 4 respiration rates at 2.5 and 0.5 mm initial buffer Pi, respectively. The shaded boxes represent the physiological extent of average free Ca2+ and mitochondrial oxygen consumption rates. At high initial buffer Pi (Fig. 2A), there was no significant effect of [Ca2+]e on State 2 and 4 respiration rates. State 3 respiration rates showed a slight increase with [Ca2+]e over the physiological Ca2+ range. However, the State 3 respiration rate exceeded the maximal in vivo rate by 20%. The State 4 respiration rate in the presence of Mg2+ most closely represented a physiological state. In Fig. 2 (A (high Pi) and B (near resting Pi)), there was no apparent influence of [Ca2+]e on State 4 respiration rates. State 3 respiration rates at low Pi may not be compared with the upper limit of the physiological respiration rate because the upper limit of the physiological respiration rate is reached under high workloads and is attained at Pi levels that are higher than the resting Pi level (14).
FIGURE 2.
Ca2+ effect on State 2, 3, and 4 respiration. Shown are respiration data plotted against [Ca2+]e during State 2 (○), State 3 (□), and State 4 (▴) at 2.5 mm (A) and 0.5 mm (B) initial buffer Pi. The shaded boxes represent the physiological regime for oxygen consumption in an intact animal and for cytosolic average free Ca2+. The data are presented as means ± S.D. of three (A) and four (B) replicates.
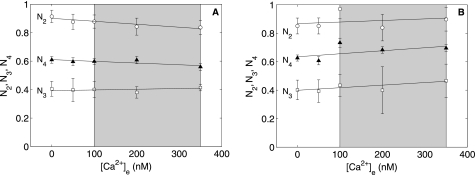
Fig. 3 (A and B) shows normalized NAD(P)H levels (N2, N3, and N4), defined under “Materials and Methods,” plotted as functions of [Ca2+]e at 2.5 and 0.5 mm initial buffer Pi, respectively. Linear fits to these data yield estimated slopes that were not different from zero (except for N4 in Fig. 3B) as inferred from the t test at a 95% significance level. The rate constant of NAD(P)H generation (k2) is a measure of the dehydrogenase (NAD(P)H-generating) flux. The estimated percent coefficients of variation of k2 were >100%, i.e. no statistically significant effects of [Ca2+]e on this parameter could be inferred.
FIGURE 3.
Influence of Ca2+ on State 2, 3, and 4 normalized NAD(P)H levels. Shown are normalized NAD(P)H data plotted against [Ca2+]e during State 2 (○), State 3 (□), and State 4 (▴) at 2.5 mm (A) and 0.5 mm (B) initial buffer Pi. The shaded boxes represent the physiological regime for cytosolic average free Ca2+. N3 and N4 data are presented as means ± S.D. of three replicates. N2 data are presented as mean ± S.D. estimated from exponential curve fitting and a local sensitivity-based method described by Landaw and Distefano (13).
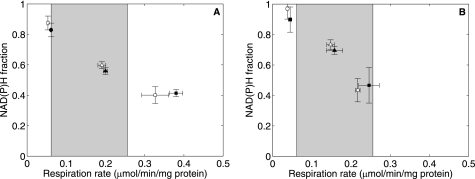
N2, N3, and N4 are plotted against their corresponding State 2, 3, and 4 respiration rates at high initial Pi at 100 nm (open symbols) and 350 nm (closed symbols) Ca2+e in Fig. 4A. If Ca2+ stimulation of mitochondrial dehydrogenase enzymes drives the mitochondrial response to [Ca2+]e, then for a given NAD(P)H level rate, an increase in [Ca2+]e should result in a higher respiration rate. The data in Fig. 4A do not support this hypothesis except at State 3 respiration rates outside of the physiological oxygen consumption rates. Fig. 4B shows the same variables plotted at low initial Pi. Here, all of the measured respiration rates were within the physiological range. Only State 3 rates demonstrated a slight effect in maintaining the same NAD(P)H level with the observed increase in respiration rate upon increasing [Ca2+]e from 100 to 350 nm. However, high ADP concentrations do not occur at resting Pi levels in vivo.
FIGURE 4.
NAD(P)H versus respiration at low and high [Ca2+]e at 2. 5 mm Pi (A) and 0.5 mm initial buffer Pi (B). The open symbols represent data at low [Ca2+]e (100 nm), and the closed symbols represent data at high [Ca2+]e (350 nm). Circles, State 2; squares, State 3; triangles, State 4. The shaded boxes represent the physiological range of respiration rates in an intact animal. All data are presented as means ± S.D. of three replicates.
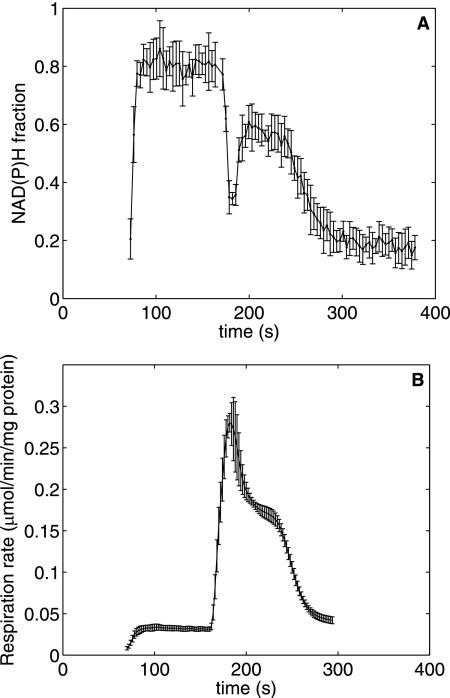
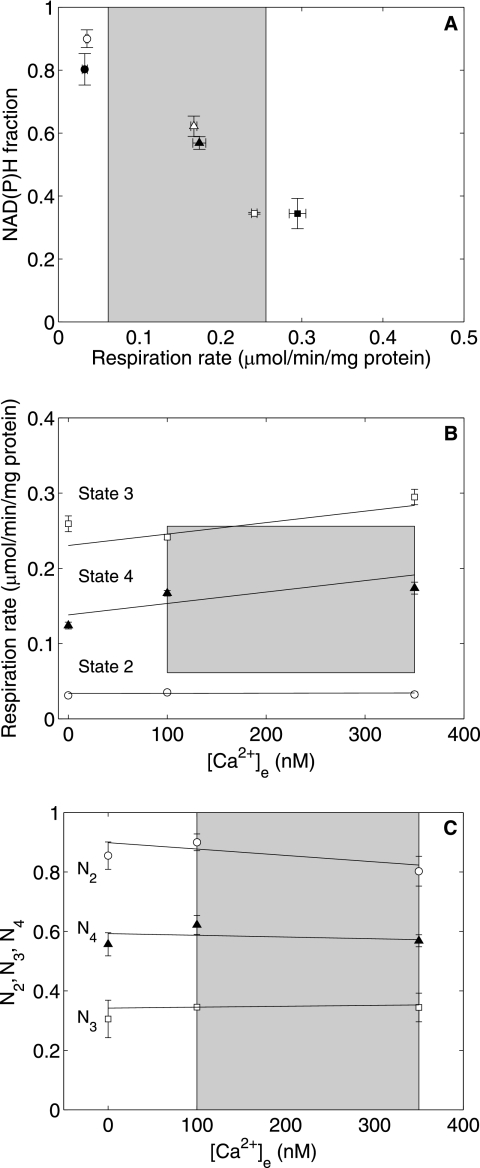
The effects of Ca2+ on respiration rates and NAD(P) reduction could depend on substrate concentrations as shown for 2-oxoglutarate (6, 17–19). Therefore, we examined the effect of [Ca2+]e on respiration and NAD(P) reduction at limiting pyruvate and malate concentrations. The initial pyruvate and malate concentrations used were equivalent to the total tissue content of those metabolites measured in a glucose-perfused heart (20) normalized to the cellular water space (16). Fig. 5 shows the time courses of normalized NAD(P)H fluorescence and respiration under limiting substrate conditions at 2.5 mm initial buffer Pi at 350 nm Ca2+e. The concentration of ADP added to induce State 3 was reduced to 175 μm to permit the formation of State 4 before the substrate became severely limiting, resulting in NAD(P)H oxidation. The plot of the NAD(P) reduction fraction versus respiratory rate in Fig. 6A shows a 22% stimulatory effect of [Ca2+]e on State 3 respiration at a constant NAD(P)H level. Fig. 6 (B and C) shows State 2-3-4 respiratory rates and redox levels plotted as functions of [Ca2+]e. The data show an apparent stimulatory effect of Ca2+ on State 3 and 4 respiration rates from 0 to 100 nm Ca2+e and no effects on NAD(P)H fractions. Extending the range of [Ca2+]e to >750 nm increased the stimulatory effect on both State 3 respiration and the NAD(P)H fraction N3 to 35%, with no apparent stimulatory effects on State 4 compared with the observations at 100 nm Ca2+e (data not shown). Although the initial concentrations of pyruvate and malate used here represent approximate physiological levels, other carbon substrates were not added. In addition, a significant fraction of pyruvate and malate was consumed before State 3 was reached in these experiments. Thus, the modest Ca2+-induced stimulation was observed under conditions of subphysiological substrate concentrations.
FIGURE 5.
NAD(P)H and respiration rates with limiting pyruvate/malate at 2. 5 mm initial Pi and 350 nm Ca2+e. A shows the time course of NAD(P)H resulting from addition of 0.1 mm pyruvate and 0.25 mm malate as substrates at 70 s and of 175 μm ADP at 164.5 s. B shows a plot of the respiration rate corresponding to the NAD(P)H data in A. All data are presented as means ± S.D. of three replicates.
FIGURE 6.
Ca2+ effect on State 2, 3, and 4 respiration and normalized NAD(P)H levels at subsaturating pyruvate/malate concentrations and 2.5 mm initial Pi. A shows a plot of NAD(P)H versus respiration rates at low (open symbols) and high (closed symbols) [Ca2+]e. B shows the respiration data plotted against [Ca2+]e during State 2 (○), State 3 (□), and State 4 (▴). C shows the NAD(P)H fractions plotted against [Ca2+]e during State 2 (○), State 3 (□), and State 4 (▴). All data are presented as means ± S.D. of three replicates.
Bishop and Atkinson (10) found that the rate of respiration in rat heart mitochondria was both a function of the ATP/ADP ratio and Pi concentration, with the Pi effects described as kinetic rather than thermodynamic as in the mass action ratio of ATP hydrolysis. However, the Pi range in those experiments was high at 2–25 mm compared with the physiological range of 0.29–2.3 mm (14). Mootha et al. (21) reported maximal mitochondrial respiration rates measured as a function of ADP at a saturating level of Pi and as a function of Pi at a saturating level of ADP in pig and dog heart mitochondria utilizing glutamate/malate as substrate. Both sets of measurements show the highest sensitivity of the State 3 respiration rate to ADP or Pi in the physiological range of concentrations of those metabolites.
Similar to the observations of Mootha et al. (21) that the physiological maximal mitochondrial rate is 80–90% of the State 3 oxygen consumption rate in their mitochondrial preparation, we found that, at 100 nm or base-line Ca2+e, the maximal physiological oxygen consumption rate was 78.2% (21.8% gap) of the State 3 respiration rate at 2.5 mm initial buffer Pi. We found that the gap between the physiological maximal mitochondrial consumption and the State 3 respiration rate was increased to 32.7% of the State 3 respiration rate at 350 nm Ca2+e. This increase corresponds to an 11% increase in respiration rate over the 100–350 nm Ca2+e range. Over a 0–350 nm Ca2+ range, the State 3 respiration rate increased by 19%, which is similar to the observations of Mildaziene et al. (6) using rat heart mitochondria respiring on 2-oxoglutarate. Mildaziene et al. reported the Ca2+ stimulation of respiration and phosphorylation fluxes by examining the relationship between membrane potential and respiratory rate during oligomycin and rotenone titrations with and without Ca2+. The highest effect on the respiratory subsystem was reported during State 3, but no data were presented for the oligomycin titration experiment that would have shown the Ca2+ effects on the respiratory subsystem during State 3.5 in their study, which corresponds to State 4 in our study.
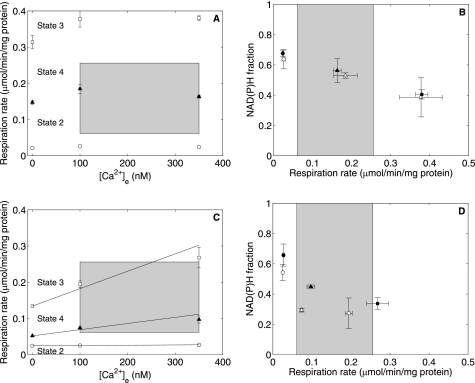
We tested the hypothesis that Ca2+ could stimulate 2-oxoglutarate dehydrogenase and thereby help support higher respiration rates at a given NAD(P)H level (18) by recording respiration rates and NAD(P)H fluorescence in mitochondria respiring on 5 mm 2-oxoglutarate at 0, 100, and 350 nm Ca2+e at 2.5 mm initial buffer Pi. The results plotted in Fig. 7 (A (respiration) and B (redox versus respiration)) show that respiration was stimulated from 0 to 100 nm Ca2+e and thereafter seemed to remain constant. The normalized NAD(P)H versus respiration rate plot shows that there is no noticeable difference between low Ca2+ (open symbols) and high Ca2+ (closed symbols) data.
FIGURE 7.
Influence of Ca2+ on respiration and NAD(P)H versus respiration using 5 mm 2-oxoglutarate (A and B) and 0. 5 mm 2-oxoglutarate and 1 mm malate (C and D) as substrates at 2.5 mm initial Pi. A and C show the respiration data plotted against [Ca2+]e during State 2 (○), State 3 (□), and State 4 (▴) presented as means ± S.D. of six (A) and two (C) replicates. B and D show the normalized NAD(P)H level plotted against the corresponding respiration rate at 100 nm (open symbols) and 350 nm (closed symbols) Ca2+e. Circles, State 2; squares, State 3; triangles, State 4. The shaded boxes represent the physiological range of respiration rates in an intact animal. The NAD(P)H fraction data in C and D are presented as means ± S.D. of three to five replicates.
The effect of Ca2+ on the respiration and redox responses of cardiac mitochondria has been found to be dependent on the substrates used, the species of the animal, and the experiment temperature (5, 6, 19, 21). The cited studies reported that the stimulatory effect of Ca2+ on State 3 mitochondrial respiration with pyruvate/malate was between 20 and 30%; therefore, subsaturating 2-oxoglutarate or saturating glutamate and malate were used as substrates to demonstrate Ca2+ stimulation of mitochondrial State 3 respiration. We found that 2-oxoglutarate achieved an overall increase in State 3 respiration rate similar to pyruvate/malate at saturating substrate concentrations (Fig. 7A), and substantial stimulation was observed at a subsaturating substrate concentration (Fig. 7C), as shown in previous studies (6, 17–19). The normalized NAD(P)H versus respiration rate plotted in Fig. 7B has a slope that is lower compared with the data in Fig. 3 (A and B) for mitochondria utilizing saturating pyruvate/malate, with no apparent Ca2+ stimulation in the physiological regime. At subsaturating 2-oxoglutarate concentrations, a 50% Ca2+ stimulation effect was seen in both respiration and redox levels in States 3 and 4 with [Ca2+]e increasing from 100 to 350 nm (Fig. 7D) (100% stimulation from 0 to 350 nm Ca2+e). These data show that the range of [Ca2+]e spanned in our study stimulates α-ketoglutarate dehydrogenase by 100%. However, note that the redox levels and respiration rates with limiting 2-oxoglutarate/malate are much lower than those obtained with limiting pyruvate/malate.
Calcium is known to be a modulator of TCA cycle enzyme kinetic fluxes as shown in part by Wan et al. (18) and Scaduto (22). Indeed, as has been observed previously, our observations reveal that, with subsaturating 2-oxoglutarate as the substrate, both respiration and NAD(P)H levels are significantly stimulated. This significant effect suggests a potential role of Ca2+ in controlling TCA cycle intermediate concentrations. The main finding of this study is that calcium stimulation of mitochondrial dehydrogenases cannot provide adequate stimulation of mitochondrial oxidative phosphorylation to serve as a primary open-loop control mechanism of oxidative phosphorylation in vivo in the heart.
A limitation of this study is the measurement of mitochondrial responses to fixed buffer Ca2+ concentrations, whereas the mitochondrion in the cell experiences transient Ca2+ levels, which might influence mitochondrial Ca2+ influx in a manner different from influx with fixed [Ca2+]e. Additionally, Baniene et al. (5) showed that the cardiac mitochondrial respiratory response in the rat has a low calcium sensitivity with succinate as a substrate compared with rabbit and guinea pig. Similarly, the low Ca2+ sensitivity of mitochondrial respiration and NAD(P)H fraction with pyruvate/malate observed in our study could potentially be species-specific. Baniene et al. also observed that the Ca2+ sensitivity of rat heart mitochondrial respiration decreased with an increase in temperature from 28 to 37 °C, which underlines the importance of maintaining the temperature in the in vitro mitochondrial preparation close to 37 °C.
In summary, in the physiological Ca2+ range, mitochondrial respiration is only modestly stimulated in State 3, at a supraphysiological ADP concentration and respiration rate. In the physiological regime, there is no apparently significant Ca2+ stimulation effect. The 22–27% stimulatory effect on State 3 respiration observed when [Ca2+]e was increased from 100 to 350 nm with both saturating and limiting substrate concentrations is not nearly enough to account for the ∼400% difference between resting and exercising respiration rates in cardiac mitochondria in vivo in terms of relative changes. Thus, the apparent direct Ca2+ stimulation of rat heart mitochondrial respiration and NAD(P)H synthesis that can be demonstrated in vitro cannot explain the full extent of in vivo regulation of oxidative phosphorylation in the heart. Our observations do not preclude potentially important effects of calcium on TCA cycle kinetics and intermediate concentrations as shown by Wan et al. (18) and Scaduto (22). Finally, the alternative hypothesis that feedback through products of ATP hydrolysis (particularly inorganic phosphate) is the primary control mechanism remains the much more feasible hypothesis (10, 14, 23).
Acknowledgments
We thank Drs. Robert Wiseman, Kathryn LaNoue, Jeroen Jeneson, and Martin Kushmerick for helpful comments.
Footnotes
This work was supported, in whole or in part, by National Institutes of Health Grant R01 HL094317 (to D. A. B.).
REFERENCES
- 1. Beard D. A., Kushmerick M. J. (2009) PLoS Comput. Biol. 5, e1000459. [DOI] [PMC free article] [PubMed] [Google Scholar]
- 2. Balaban R. S., Kantor H. L., Katz L. A., Briggs R. W. (1986) Science 232, 1121–1123 [DOI] [PubMed] [Google Scholar]
- 3. Katz L. A., Swain J. A., Portman M. A., Balaban R. S. (1989) Am. J. Physiol. 256, H265–H274 [DOI] [PubMed] [Google Scholar]
- 4. Territo P. R., Mootha V. K., French S. A., Balaban R. S. (2000) Am. J. Physiol. Cell Physiol. 278, C423–C435 [DOI] [PubMed] [Google Scholar]
- 5. Baniene R., Nauciene Z., Maslauskaite S., Baliutyte G., Mildaziene V. (2006) Systems Biol. 153, 350–353 [DOI] [PubMed] [Google Scholar]
- 6. Mildaziene V., Baniene R., Nauciene Z., Marcinkeviciute A., Morkuniene R., Borutaite V., Kholodenko B., Brown G. C. (1996) Biochem. J. 320, 329–334 [DOI] [PMC free article] [PubMed] [Google Scholar]
- 7. Dibb K. M., Eisner D. A., Trafford A. W. (2007) J. Physiol. 585, 579–592 [DOI] [PMC free article] [PubMed] [Google Scholar]
- 8. Ward M. L., Pope A. J., Loiselle D. S., Cannell M. B. (2003) J. Physiol. 546, 537–550 [DOI] [PMC free article] [PubMed] [Google Scholar]
- 9. Bradford M. M. (1976) Anal. Biochem. 72, 248–254 [DOI] [PubMed] [Google Scholar]
- 10. Bishop P. D., Atkinson D. E. (1984) Arch. Biochem. Biophys. 230, 335–344 [DOI] [PubMed] [Google Scholar]
- 11. Tsien R., Pozzan T. (1989) Methods Enzymol. 172, 230–262 [DOI] [PubMed] [Google Scholar]
- 12. Chance B., Williams G. R. (1955) J. Biol. Chem. 217, 409–427 [PubMed] [Google Scholar]
- 13. Landaw E. M., DiStefano J. J., 3rd (1984) Am. J. Physiol. 246, R665–R677 [DOI] [PubMed] [Google Scholar]
- 14. Wu F., Zhang E. Y., Zhang J., Bache R. J., Beard D. A. (2008) J. Physiol. 586, 4193–4208 [DOI] [PMC free article] [PubMed] [Google Scholar]
- 15. Tune J. D., Richmond K. N., Gorman M. W., Olsson R. A., Feigl E. O. (2000) Am. J. Physiol. 278, H74–H84 [DOI] [PubMed] [Google Scholar]
- 16. Vinnakota K. C., Bassingthwaighte J. B. (2004) Am. J. Physiol. 286, H1742–H1749 [DOI] [PubMed] [Google Scholar]
- 17. Hansford R. G., Castro F. (1981) Biochem. J. 198, 525–533 [DOI] [PMC free article] [PubMed] [Google Scholar]
- 18. Wan B., LaNoue K. F., Cheung J. Y., Scaduto R. C., Jr. (1989) J. Biol. Chem. 264, 13430–13439 [PubMed] [Google Scholar]
- 19. Panov A. V., Scaduto R. C., Jr. (1996) Am. J. Physiol. 270, H1398–H1406 [DOI] [PubMed] [Google Scholar]
- 20. Okere I. C., McElfresh T. A., Brunengraber D. Z., Martini W., Sterk J. P., Huang H., Chandler M. P., Brunengraber H., Stanley W. C. (2006) J. Appl. Physiol. 100, 76–82 [DOI] [PubMed] [Google Scholar]
- 21. Mootha V. K., Arai A. E., Balaban R. S. (1997) Am. J. Physiol. 272, H769–H775 [DOI] [PubMed] [Google Scholar]
- 22. Scaduto R. C., Jr. (1994) Eur. J. Biochem. 223, 751–758 [DOI] [PubMed] [Google Scholar]
- 23. Bose S., French S., Evans F. J., Joubert F., Balaban R. S. (2003) J. Biol. Chem. 278, 39155–39165 [DOI] [PubMed] [Google Scholar]


