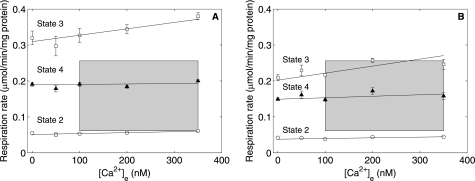
FIGURE 2.
Ca2+ effect on State 2, 3, and 4 respiration. Shown are respiration data plotted against [Ca2+]e during State 2 (○), State 3 (□), and State 4 (▴) at 2.5 mm (A) and 0.5 mm (B) initial buffer Pi. The shaded boxes represent the physiological regime for oxygen consumption in an intact animal and for cytosolic average free Ca2+. The data are presented as means ± S.D. of three (A) and four (B) replicates.

