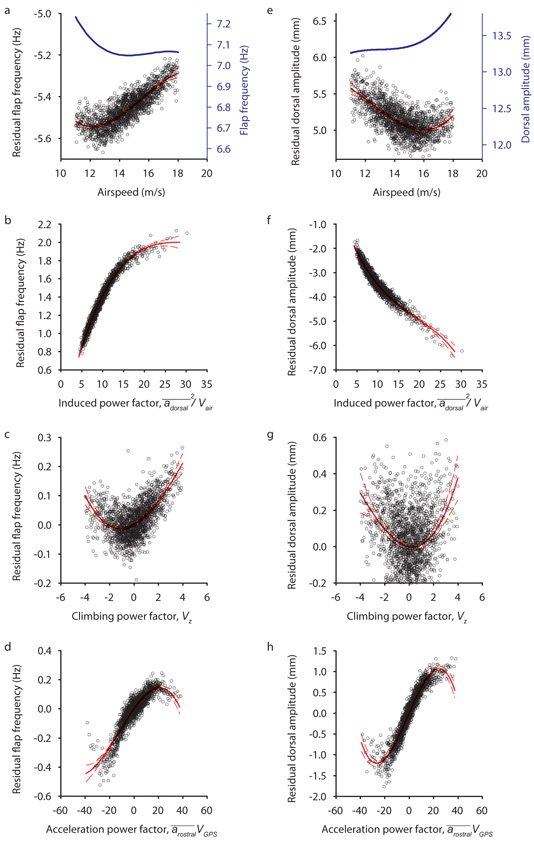
Figure 2.
The influence attributable to airspeed (a,e), induced power (b,f), climbing power (c,g) and accelerating power (d,h) on flap frequency (a-d) and dorsal amplitude (e-h) over each flap (18 pigeons, 171,209 flaps). Red curves show 3rd order polynomial fits; points show the values once the influence of all other factors have been removed. Each point represents the average of 100 flaps, binned along the x-axis. Dashed red lines show +/− 99.99% confidence intervals. Blue curves (a,e) show the relationship predicted if the effect of both airspeed and induced power (which includes airspeed as a term) are combined; in effect, the relationship that would be observed for steady, straight, level flight.

