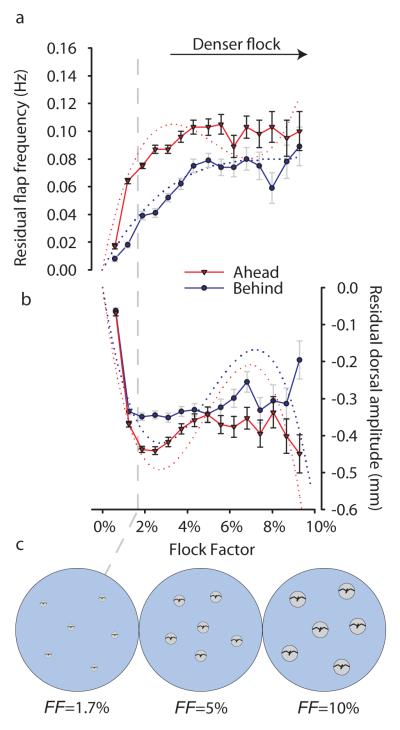
Figure 3.
The relationship between Flock Factor – the proportion of hemisphere-view covered by other pigeons for every flap, illustrated graphically with six neighbouring birds (c) – and flap frequency (a) or dorsal displacement amplitude (b). The vertical grey dashed line indicates the mean Flock Factor (1.7%), the underlying dotted lines the 3rd order polynomial fits used in the statistical separation of factors, and error bars show s.e.m. Flight in a cluster flock, particularly when flying behind other birds, is associated with an increase in flap frequency and decrease in dorsal amplitude.

